Students can Download Economics Chapter 1 Introduction Questions and Answers, Notes Pdf, 1st PUC Economics Question Bank with Answers helps you to revise the complete Karnataka State Board Syllabus and score more marks in your examinations.
Karnataka 1st PUC Economics Question Bank Chapter 1 Statistics for Economics Introduction
1st PUC Economics Introduction TextBook Questions and Answers
Question 1.
Mark the following statements as true of false.
Answer:
- Statistics can only deal with quantitative data. False
- Statistics solves economic problems. True
- Statistics is of no use to economists without data. True
Question 2.
Make a list of activities that constitute the ordinary business of life. Are these economic activities?
Economics activities:
Answer:
- Working in a field.
- Working in a factory or office
- Shopkeeper
- Treatment to a patient by a doctor
- Teachers teaching in school
Non-Economic activities:
- Teacher teaching his own son
- Nurse serving her old mother
- Cooking of food by the housewife in her home.
![]()
Question 3.
The Government and policy makers use statistical development to formulate suitable policies of economic development. Illustrate with two examples.
Answer:
The statistical data is important for Government and policy makers to formulate suitable policies of economic development. It not only helps in analysing and evaluate the outcomes of the past policies but also assist them to take corrective measures and to formulate new policies accordingly. It is clear from examples.
1. It can be ascertained by using statistical techniques whether the policy of family planning is effective in checking the problem of rapidly growing population.
2. In preparing annual Government budgets, previous data of Government expenditures and Government resources are taken into consideration for estimating the allocation of funds among various projects.
Question 4.
‘You have unlimited wants and limited resources to satisfy them’. Explain by giving two examples?
Answer:
Every individual have unlimited wants but the resources for satisfying the wants are limited. Scarcity is the root of all economic problems. If there has been no scarcity there would have been no economic problem. This can be understood by examples.
1. Achild’s pocket money is limited so he/she has to choose only those things that they want the most. You can’t purchase almost all the things you want.
2. A land available should be put in use either in agricultural or industrial. We can’t use same land for both activities.
Question 5.
How will you choose the wants to be satisfied?
Answer:
Any individual fulfills his/her wants according to his/her needs satisfaction and priority attached to different wants. Moreover, the choice of want also depends on the need of the time and availability of means (money) to purchase that want.
Question 6.
What are your reasons for studying Economics?
Answer:
The reasons for studying economics are:
- To study the theory of consumption
- To study the theory of production
- To study the theory of distribution
- The study of economics also helps us to understand and analyse the root cause of basic problems faced by an economy.
![]()
Question 7.
Statistical methods are no substitute for common sense?
Answer:
This is true that statistical methods are no substitute for common sense. Statistical data should not be believed blindly as it can be misinterpreted or misused. The statistical data may involve personal bias or may undergo manipulations, also, statistical data and methods fail to reveal the errors committed by an investigator while surveying and collecting data. This can be understood by a story.
It is said that a family of four persons (husband, wife and two children) once set out to cross a river. So he calculated the average height of his families members since the average height of his family members was greater than the average depth of the river. He thought they could cross safely.
Consequently some members of the family (children) drowned while crossing the river. Thus commonsence must be used while applying statistical methods.
1st PUC Economics Introduction Additional Questions and Answers
1st PUC Economics Introduction Very Short Answer Type Questions
Question 1.
What is Economics?
Answer:
The term Economics is derived from two Greek words
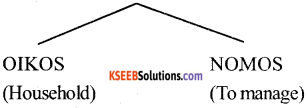
so totally it means ‘The art of house hold management’.
Question 2.
What is statistics in Singular Sense?
Answer:
In Singular Sense ‘Statistics is a science which concerns itself with the collection, presentation, analysis, and interpretation of numerical data.
Question 3.
What is Data?
Answer:
The term ‘data’ refers to ‘numerical information about social or economic activities’.
![]()
Question 4.
Who is called as the father of Economics?
Answer:
‘Adam Smith’ is called as the ‘father of Economics’.
Question 5.
Name the book written by Adam Smith?
Answer:
‘Wealth of Nations’ is the book written by Adam Smith, which was published in 1776.
Question 6.
What do you mean by scarcity in Economics?
Answer:
Scarcity means lack of something or anything which is in shortage of fulfill human wants.
Question 7.
What do you mean by ‘Ends’ and ‘Means’?
Answer:
According to Lionel Robbins ‘Ends’ refer to human wants and ‘Means’ refer to resources.
Question 8.
What do you mean by Production?
Answer:
The term production refers to the process of converting raw materials into finished goods. It also include raising of crops, forestry, animal husbandry, poultry farming etc.,
![]()
Question 9.
What do you mean by Consumption?
Answer:
The act of using goods and services of satisfy our wants is called consumption.
Question 10.
Wh at do you mean by Distribution?
Answer:
In Economics, distribution refers to the rewards paid to the four factors of production (Land, Labour, Capital and Organisation). It includes rent, wages, interest, and profit.
Question 11.
What is Exchange?
Answer:
The term ‘Exchange’ refers to purchase and sale of goods and services. It involves transfer of products from the seller to the buyer for price.
Question 12.
Who is the father of Statistics?
Answer:
Sir Ronald AFisher is called as father of modem statistics.
![]()
Question 13.
Mention the two types of data?
Answer:
The two types of data are:
- Quantitative data
- Qualitative data
Question 14.
Why does the problem of choice arise?
Answer:
The problem of choice arises due to the following reasons:
- Human wants are unlimited
- To satisfy unlimited wants, the resources are limited
- The resources can be put to alternative uses, though they are limited in supply.
OR
The problem of choice arises due to the unlimited wants and limited resources.
Question 15.
Who is a Consumer?
Answer:
A consumer is one who consumes goods & services.
Question 16.
Who is a Producer?
Answer:
A producer is one who produces and sells goods and services for the generation of income.
Question 17.
Give two examples of Quantitative Data?
Answer:
- Price of goods
- Income of individuals
![]()
Question 18.
Give two examples of Qualitative Data?
Answer:
- Intelligence of individuals
- Tastes and preferences of individuals.
1st PUC Economics Introduction Short Answer Type Questions
Question 1.
Name the four factors of Production?
Answer:
The factors of production are:
- Land
- Labour
- Capital
- Organisation
Question 2.
Write any two forms of scarcity as you see in your daily life?
Answer:
The two forms of scarcity as we see in our daily life are :
- Scarcity of water
- Scarcity of petrol
- Scarcity of agricultural resources etc.,
- Scarcity of power.
Question 3.
What is Exchange? What does it Study?
Answer:
The term ‘Exchange’ refers to purchase and sale of goods and services for something in return. It studies – market, prices, finance, and trade, etc.,
![]()
Question 4.
What is meant by statistical methods? What are the important statistical methods?
Answer:
Statistical methods refers to general principles and techniques which are commonly used in the collection, analysis, and interpretation of data.
Following are the important statistical methods:
- Collection of data
- Organisation of data
- Presentation of data
- Analysis of data
- Interpretation of data.
Question 5.
Write the important functions of Statistics?
Answer:
The important functions of Statistics are:
- Presentation of data or facts
- Simplification of facts
- Comparison of related facts
- It helps in correlating the data
- Statistics helps in forecasting the future behaviour
Question 6.
Briefly explain the three distinct component of Economics?
Answer:
Three distinct components of economics are consumption, production, and distribution,
1. Consumption – Using of goods for satisfying human needs is called consumption.
2. Production – Adding or increasing the utility of a commodities is known as production
3. Distribution – It means the distribution of the national income or the total income arising from what has been produced in the country called (GDP).
1st PUC Economics Introduction Long Answer Type Questions
Question 1.
Distinguish between ‘Quantitative’ and ‘Qualitative’ data and give some examples of both?
Answer:
Quantitative data:
Quantitative data is referred to as data measured with help of numerical facts or terms For example
- Daily temperature
- Fleight
- Weights of individuals
- Price
- Income etc.,
are quantitative variables. Their values can be expressed numerically.
Qualitative data :
When data is measured with the help of attributes or character it is Qualitative data. Qualitative data is the data which can not be measured with help of numerical values.
Example:
- Attitudes of people to a political system.
- Intelligence of individuals
- Music and art
- Beauty of individual cannot measured numerically.
![]()
Question 2.
What are your reasons for studying statistics?
Answer:
Statistics is widely used in modem times. Now-a-days statistics is useful to bankers, workers, labourers, workers, trade associations, insurance companies, auditor, social workers, chamber of commerce, politics etc.,
Uses of Statistics:
1. Useful to Politicians:
The politicians and their supporters are immensely interested in knowing their prospects of
winning election. It helps them to know the percentage of vote may candidate will receive in the election can be worked out.
2. Useful to insurance companies:
Statistics is also very useful to insurance companies. Insurance companies premium rates are determined with help of mortality tables which are based on mortality experience statistics.
3. Useful to economics :
Statistics serves as a raw materials to the economists in making certain economic laws.
4. Useful of finance minister:
The finance minister is responsible for preparing the annual budget of the country. For preparation of better annual budget plan there will be high necessity of statistics.
5. Bankers:
Statistics is very much useful for bankers and banking industry. Every bank has a statistical department. This department helps the bank to make its own policy.
6. Useful to Business man:
It is necessary for an efficient businessman to have the full knowledge of the factors which influence his business decisions. He must know the probable demand in future and we must calculate the cost of production. All this can be done with the help of statistics and statistical methods.
Question 3.
Give the limitations of Statistics?
Answer:
The following are the limitations of statistics:
1. It does not study the qualitative aspect of a problem.
2. It does not study the individuals:
It is study of a mass data and deals with aggregates of facts.
3. Statistical laws are true only on an average:
They are not universally applicable like the laws of chemistry, physics, and mathematics. They are true on an average because the results are affected by a large number of causes.
4. Statistics can be manipulated:
The results obtained can be manipulated according to one’s own interest and such manipulated results can mislead the community.
5. Statistical results lack mathematical accuracy:
The results drawn from statistical analysis are normally approximates. As the statistical analysis is based on observation of mass data, number of inaccuracies may be present and it is difficult to rectify them.
![]()
Question 4.
Describe the function of Statistics?
Answer:
The functions of statistics are:
1. Presentation of facts in figures:
Statistics presents the various facts and figures, in such a manner so that various complicated facts become easy, brief and concrete and they may be understood easily.
2. Establishment of relationship:
With the help of statistical methods (correction) relationship between two or more facts may be established.
3. Comparison:
Two or more effects may be compared with the help of statistics. Various averages, rates, percentages, and co-efficients are used for this purpose.
4. Interpretation of problems:
With the help of statistical devices, interpretation of various problems may be done.
5. Formation of laws and principles of other sciences:
Statistics helps to other social and natural sciences in forming the laws and with its help the various rules and principles of those sciences may be tested.
6. Helpful in deciding the policy:
With the help of statistics various policy decisions may be taken logically and successfully.
Question 5.
Name the stages of statistical study and statistical tools for presentation of data.
OR
Describe the main stages of statistics and their related tools.
Answer:
Stages of statistics:
Following are main stages of statistics.
1. Collection data:
It refers to gather some statistical facts by different methods.
2. Organisation of data:
In tills stage the organised data are presented in the form of graphs, diagrams, tables etc.,
3. Presentation of data:
In this stage the organised data are presented in the form of graphs, diagrams, tables etc.,
4. Analysis of data:
In the fourth stage we analyse the data in terms of averages of percentages.
5. Interpretation of data:
This is the last stage of statistics. In this stage, we interpret the data to find some conclusion.
| Stage | statistical study | statistical tools |
| Stage-1 | Collection of data techniques | census or sample |
| Stage-2 | Organisation of data | Array of data and tally bar |
| Stage-3 | Presentation of data | Tables, graphs & diagrams |
| Stage-4 | Analysis of data | Percentage, averages |
| Stage-5 | Interpretation of data | Magnitude of percentage, average, degree of relationship between variables. |