Students can Download Economics Chapter 3 Organisation of Data Questions and Answers, Notes Pdf, 1st PUC Economics Question Bank with Answers helps you to revise the complete Karnataka State Board Syllabus and score more marks in your examinations.
Karnataka 1st PUC Economics Question Bank Chapter 3 Organisation of Data
1st PUC Economics Organisation of Data TextBook Questions and Answers
Question 1.
Which of the following alternatives is true?
i) The class midpoint is equal to:
a. The average of the upper class limit and the lower class limit.
b. The product of upper class limit and the lower class limit.
c. The ratio of the upper class limit and the lower class limit
d. None of the above
Answer:
a. The average of the upper class limit and the lower class limit.
ii) The frequency distribution of two variable is known as
a. Univariate Distribution
b. Bivariate Distribution
c. Multivariate Distribution
d. None of the above
Answer:
b. Bivariate Distribution
![]()
iii) Statistical calculation is classified data are based on
a. the actual values of observations
b. the upper class limits
c. the lower class limits
d. the class midpoints
Answer:
d. the class midpoints
iv) Under Exclusive method
a. the upper class limit of a class is excluded in the class interval
b. the upper class limit of a class is included in the class interval
c. the lower class limit of a class is excluded in the class interval
d. the upper class limit of a class is included in the class interval
Answer:
a. the upper class limit of a class is excluded in the class interval
v) Range is the
a. difference between the largest and the smallest observations
b. difference between the smallest and the largest observations.
c. average of the largest and the smallest observations
d. ration of the largest to the smallest observation
Answer:
a. difference between the largest and the smallest observations
Question 2.
Can there be any advantage in classifying things? Explain with an example from your daily life.
Answer:
Advantage of Classifiction:
- It helps in the comparison of data.
- It helps us to understand the relationship among variable.
- It highlights significant features of the data at a glance.
- It makes the statistical analysis of the data easier.
- It arranges and presents huge volume of raw data in meaningful and condensed form.
![]()
Question 3.
What is a variable? Distinguish between a discrete and a continuous variable.
Answer:
In Statistics the term variable is used, only if the changing characteristics can be numerically measured. The heights and weights of individuals are variables, as they can be measured in numerical terms. Prices of commodities vary in time and scope and they can be numerically measured, so the price is variable.
1. Continuous variable:
It can take all values in a given range for example, heights and weights of individuals, prices of commodities income o individuals may be treated as continuous variable.
2. Discrete variables:
If the variables can only some particular value like whole numbers, it is called as discrete variable for example number of students in different classes on different schools or the size of the households.
Question 4.
Explain the ‘exclusive’ and ‘inclusive’ methods used in classification of data.
Answer:
There are two methods of classifying the data according to class – intervals, namely exclusive method and Inclusive method.
1. Exclusive method:
This method is useful whether the value is complete number or in decimals. In case of exclusive series, value of the upper limit of a class is included in the lower limit of the next class interval. Value of the upper limit of the class is included in that very class interval.
2. Inclusive series :
In inclusive series value of the upper limit of a class is included in that very class interval. Inclusive series is useful when value is an incomplete number.
Question 5.
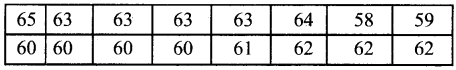
Use the data in Table (given below) that relate to monthly household expenditure, (in Rs.) on food of 50 households and
Answer:
(i) Obtain the range of monthly household expenditure on food.
(ii) Divide the range into appropriate number of class intervals and obtain the frequency distribution of expenditure.
(iii) Find the number of households, whose monthly expenditure on food is.
- Less than Rs. 2000
- More than Rs. 3000
- Between Rs. 1500 and Rs. 2500
Monthly household expenditure (in Rs.) on Food of 50 households.
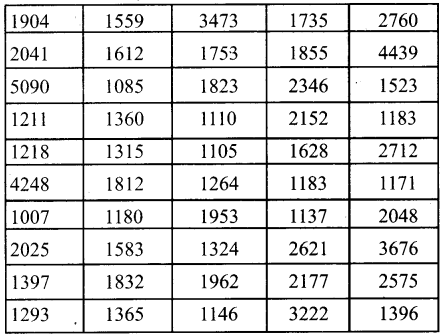
(i) Range = Largest value – smalles value
= 5500 – 1007 = 4083
![]()
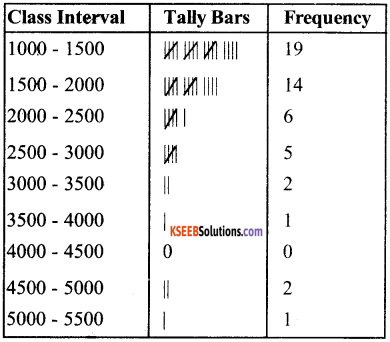
(ii)
(iii)
- Number of household whose expenditure on food is less than Rs. 2000 = 19 + 14 = 33
- More than Rs. 3000 = 2 + 1 + 2 + 1=6
- Between Rs. 1500 and Rs. 2500 = 14 + 6 = 20
Question 6.
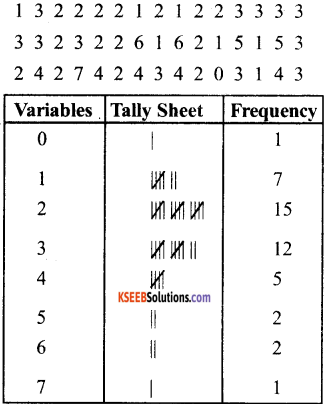
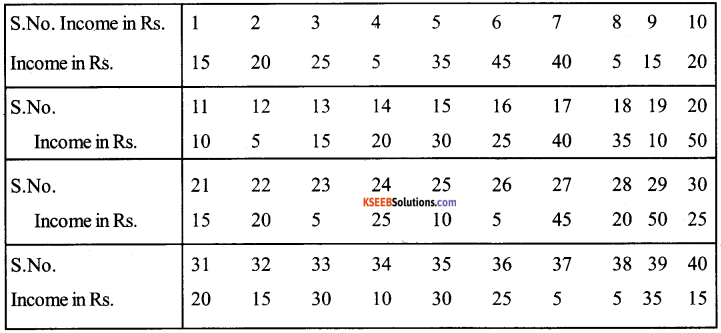
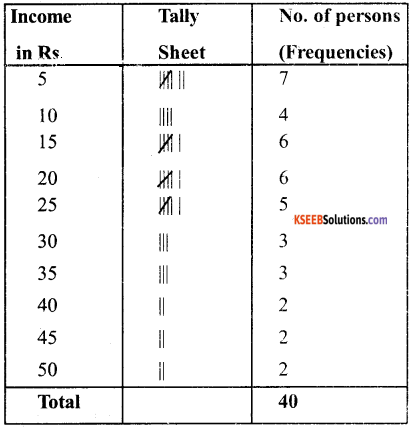
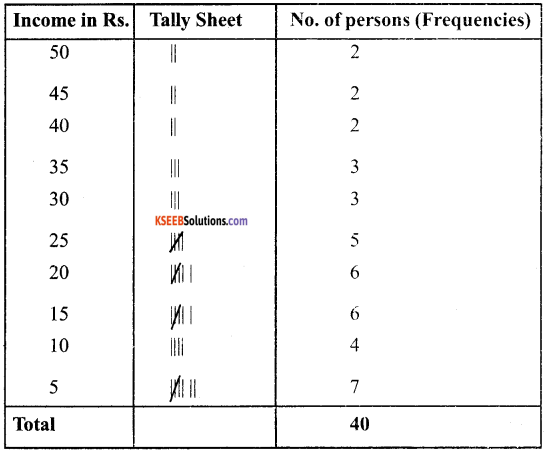
In a city, 45 families were surveyed for the number of domestic appliances they used prepare a frequency array based on their replies as recorded below. (6)
Answer:
Question 7.
Do you agree that classified data is better that Raw data?
Answer:
The data collected from Primary and Secondary Sources are raw data are summarised and made comprehensible by classification. When facts of similar characteristics are placed in the same class it enables one to locate them easily, make comparison and draw inferences without any difficulty.
![]()
Question 8.
Distinguish between univariate and bivariate frequency distribution
Answer:
1. Univariate Frequency Distribution:
The frequency distribution of a single variable is called a univariate distribution for example marks of a student.
2. Bivariate Frequency Distribution:
A private frequency distribution is the frequency distribution of two variables, for example the table shows the sales and advertisement expenditure of the firm. They are classed in different rows.
Question 9.
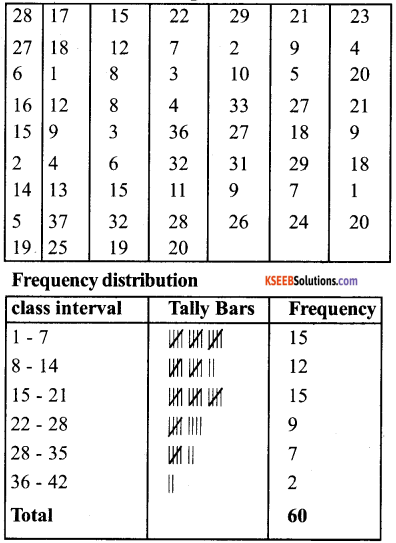
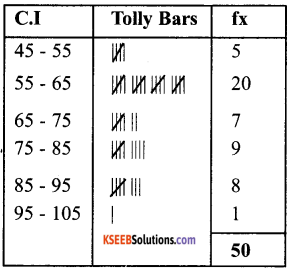
Prepare a frequency distribution by inclusive method taking class interval of 7 from the following data
Answer:
1st PUC Economics Organisation of Data Additional Questions and Answers
1st PUC Economics Organisation of Data Very Short Answer Type Questions
Question 1.
What is meant by classification?
Answer:
Classification is the grouping of related facts into different classes.
Question 2.
What is quantitative classification?
Answer:
Statistical Data classified into classes or groups on the basis of their numerical values is called quantitative classification.
![]()
Question 3.
What is meant by Statistical services?
Answer:
Arranging of data in different classes according to a given order is called series.
Question 4.
What are the class limits?
Answer:
The extreme values of a classes are limits.
Question 5.
What is meant by exclusive series?
Answer:
Exclusive series is that series in which every class interval excludes items corresponding to its upper limit.
Question 6.
What is meant by inclusive series?
Answer:
An inclusive series is that series which include all items upto its upper limit.
Question 7.
What is meant by class interval or class magnitude?
Answer:
Magnitude of a class interval is the difference between the upper limit and the lower limit of a classes.
Question 8.
What is meant by ‘frequency’?
Answer:
Frequency is the number of times an item occur (or repeat itself) in the series.
![]()
Question 9.
What is meant by individual series?
Answer:
Individual series are those series in which the items are listed singly.
Question 10.
What is discrete series?
Answer:
A discrete series of frequency array is that series in which data are presented in a way that exact measurement of items are clearly shown.
Question 11.
What is meant by a continuous series or frequency distribution?
Answer:
It is that series in which items cannot be exactly measured. The items assume a range of values and are placed within the range or limits.
Question 12.
What is an open ended series?
Answer:
An open ended series is that series in which lower limit of the first class interval and the upper limit of last class interval is missing.
![]()
Question 13.
What is meant by cumulative frequency series?
Answer:
Cumulative frequency Series is that series in which the frequencies are continuously added cooresponding to each class interval in the series.
Question 14.
Daily expenses of five persons are 15, 20, 35, 40, 55 Calculate the magnitude.
Answer:
magnitude = 55 – 15 = 40
Question 15.
Arrange the following series in an ascending order 8,14,5,4,2,25
Answer:
2, 4, 5, 8, 14, 25
Question 16.
Arrange the following series in descending order 17,13,22,15,32
Answer:
32,22,17,15,13
Question 17.
What do you understand by raw data?
Answer:
The data in their original form are called raw data.
![]()
Question 18.
What is frequency?
Answer:
The term frequency signifies the number of items or a value repeated in a given set of information.
Question 19.
What do you understand by the term ‘array’?
Answer:
When individual data are arranged in an increasing or decreasing order, it is known as an array.
Question 20.
What is a series?
Answer:
A series is a systematic arrangement of items in a particular order or sequence.
Question 21.
What are the three types of series?
Answer:
There are three types of series.
- Series of individual observations
- Discrete series
- Continuous series
Question 22.
What is discrete series?
Answer:
A series is called discrete when the frequency of various items are given separately.
![]()
Question 23.
What is frequency distribution?
Answer:
The presentation of observations of classes horizontally and individual items which fall in class are written according to ascending order of magnitude.
Question 24.
What is cumulative frequency series.
Answer:
The type of presentation where the frequencies are represented by adding the frequency of each previous class.
Question 25.
What is quantitative classification?
Answer:
Classification done according to quantitative varieties like marks, wages etc are quantitative classification.
Question 26.
What is quantative classification?
Answer:
Classification according to attributes like honesty, beauty is known as quantitative classification.
1st PUC Economics Organisation of Data Short Answer Type Questions
Question 1.
What do you understand by classification of data?
Answer:
‘Classification’ means arranging things in an appropriate order and putting then into homogeneous groups for example, in library, the books and periodicals are classified and arranged according to subjects. Students are grouped according to division they secure in a certain examination.
Plants and animals may be assigned to groups distinguished by structure, origin etc. Data may be arranged by time or space or both. For example, we have time series data on aggriegate income, aggregate consumption, size of the population
![]()
Question 2.
Arrange the countries in ascending order and descending order of yield.
Yield of wheat of different countries
Answer:
| Country | Yield of wheat (Kg / acre) |
| America | 1925 |
| Brazil | 127 |
| China | 893 |
| Denmark | 225 |
| France | 439 |
| India | 862 |
In Ascending order
| Country | Yield of wheat (Kg / acre) |
| Brazil | 127 |
| Denmark | 225 |
| France | 439 |
In Descending order
| Country | Yield of wheat (Kg / acre) |
| America | 1925 |
| China | 893 |
| India | 862 |
| France | 439 |
| Denmark | 225 |
| Brazil | 127 |
Question 3.
Distinguish between (a) variable and (b) attribute. Explain with example:
Answer:
Variable:
In Statistics, the term variable is used, only if, the changing characteristics can be numerically measured thus, heights and weights of individuals variables, as they can be measured in numerical terms, price of commoditites vary over time and space and they can be numerically measured therefore prices is a variable.
Similarly, income of individuals, household expenditures on various items of consumptions, size of household, input and outputs of firms are all variables.
Attribute:
The looks of people, their intelligence and aptitude for art and music change from one individual to the other, they cannot be measured numerically in the same way as heights and weights or prices and incomes.
Therefore, they are not called variable in the statistical sense. They are called ‘attributes’. We may rank individual according to the quality of attributes. The ranks are sometimes used as their numerical values for purposes of analysis.
![]()
Question 4.
Explain the term ‘population’ as it is used in statistics Define
- Univariate
- Bivariate and
- multivariate Population.
Answer:
In common language the word ‘Population’ means the number of personal living in a certain region. We may find the population of certain animals in forests in a country or the population of certain plants in a garden and so on the term population implies ‘ head count ’.
However, in statistics, the data on any single variable, or a set of variables, for all individual units in a region, constitute the population of that variable, or variables.
1. Univariate:
If the data are on a single variable, the set of measurements constitutes a univariate population of that variable. We have a bivariate or multivariate population of the set variables. For example, we may have a univariate population of prices or a population of incomes, We may have a bivariate population of height and weights of all individuals in a region.
2. Multivariate:
A multivariate population of expenditure on various items of consumption of all households.
Question 5.
Define organisation of data.
Answer:
After the data has been collected either with the help of the sampling method or census method the work of its organisation starts. The organisation of data means a systematic artangements of collected figures so that the data becomes easy to understand and more convenient for further statistical treatment. This systematic arrangement changes into a satistical series.
Question 6.
What are the differences between exclusive and inclusive series?
Answer:
1. In case of exclusive servies, the upper limit of one class interval is the lower limit of the next class interval.
2. In case of exclusive series, value of the upper limit of a class is included in the lower limit of the next class interval. In inclusie series value of the upper limit of a class is included in that very class interval.
3. Exclusive series is useful whether the variables complete number or in decimals, but inclusive series is useful only when value is in complete number.
Question 7.
In the following time series in which year do you find the population of India to be the minimum. Find the year when it is the maximum.
Answer:
| Year | Population |
| 1951 | 35.7 |
| 1961 | 43.8 |
| 1971 | 54.6 |
| 1981 | 68.4 |
| 1991 | 81.8 |
| 2001 | 102.7 |
India’s population in the year 1951 was the minimum It was 35.7 crores. Maximum population was in the year 2001. It was 102.7 crores.
![]()
Question 8.
In the given table frequency distribution of marks in mathematics of 100 students are given. Express the values of frequency as percentage of total frequency [Relative frequency] Which class has the maximum and minimum concentration of data?
Answer:
| Marks | Frequency |
| 0- 10 | 1 |
| 10-20 | 8 |
| 20-30 | 6 |
| 30-40 | 7 |
| 40-50 | 21 |
| 50-60 | 23 |
| 60-70 | 19 |
| 70-80 | 6 |
| 80-90 | 5 |
| 90 – 100 | 4 |
| Total | 100 |
1. maximum conuntration of data is in class (50-60)
2. minimum concentration of data is in class (0-10)
Question 9.
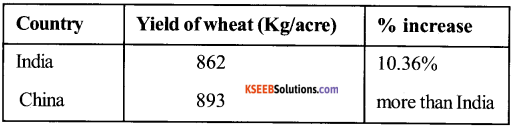
Find the country whose yield of wheat is slightly more than that of India. How much would that be in terms of percentage
Answer:
Yield of wheat for different countries
| Country | Yield of wheat (Kg/acre) |
| America | 1925 |
| Brazil | 127 |
| China | 893 |
| Denmark | 225 |
| France | 439 |
| India | 862 |
1st PUC Economics Organisation of Data Long Answer Type Questions
Question 1.
What is a frequency distribution? What are the main points underlying the construction of a frequency distribution?
Answer:
The largest value of ‘x’ is B and smaller value is A. then x = B – A is the total range of ‘x’. A large range indicates that the total the values of ‘x’ are spread over a large interval or the variation of values of ‘x’ is large. A small range indicates smaller variation in the values of ‘x’, this, the range is measures of variation (or dispersion) of ‘x’.
In order to get a better idea about the distibution of values within the range, we should subdivide the total range into a number of class intervals and find out the number of values in different classes. The main points underlying the construction of a frequency distribution are as follows.
a. Construction of Discrete frequency Distribution:
1. Prepare a table with three columns first for variable under study, second for ‘Tally bars’ and the third for the total, Representing corresponding frequency to each value of size of the variable.
2. Place all the values of the first column ascending order – beginning with the lowest end giving to the highest. The gap between one magnitude to another may preferably be the same.
3. Put bars (vertical lines) in front of the values according in the second column keeping in view the number of items a particular value repeats, itself. This column is for facility in counting blocks of five bars or ![]() are prepared and some space is left between each block of bars.
are prepared and some space is left between each block of bars.
4. Count the number of bars in respect of each value in the variable and place it in the third column made for total of frequency.
b. Construction of continuous frequency Distribution:
There are two methods of classifying the data according to class intervals.
Exclusive method:
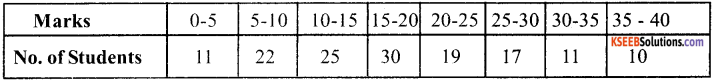
Under this method upper limits are excluded. The upper limits of class intervals is the lower limit of the next class for example, if the students obtained marks are grouped as 5 – 10, 10-15, 15-20, 20-25, 25-30 etc. we include in first group of students whose marks are 5 or more but under 10. If the marks of a students are 10 he is not included in the first group but in the second, i.e., 10 -15
Inclusive method:
Under this method upper class limits of classes are included in respective classes for example, if the students obtained marks are grouped as 5 – 9, 10-14, 15-19, 20-24, 25-29 etc in the group 5-9, we include in first group students whose marks is between 5 and 9. If the marks of students are 10 he is included in the next class, i.e., 10 to 14. If there are no whole numbers, the classes can be made 5-9.9, 10-14.9, 15-19.9 and so on.
Question 2.
How many classes can we choose? How does one decide about the size of class intervals?
Answer:
There is no hard and fast rule about how many class we can choose, but as a working rule the number of classes should lie between 5 and 15. It should be noted that the number of classes will be large if we choose small size class intervals and it will be small if the size of class intervals in large.
As an illustration, suppose the range is 70, and we choose classes of width 2 each. We would require 70 ÷ 2 = 35 classes. However, the number of classes would be 14 if the width of each class was 5.
Size of class intervals:
We may choose all classes of the same width or of different width in the case of equal class intervals the size of the class interval is determined as soon as we have decided about the member of classes suppose ‘n’ is the number of classes and all classes are of width, ‘n’ then n × h = R.
Knowing the range R and number of classes n we can obtain \(\mathrm{h}=\frac{\mathrm{R}}{\mathrm{n}}\) as the width of the class interval. If the range is 70 and we choose 10 classes, the width is 7.
Choice of class limits:
Suppose ‘X’ is a continous variable, such that it can take any value in a given range. In that case, it is possible to choose class limits which are not equal to any of the observed values for example, height of individuals is a continuous variable.
Even though, in practice, one can measure height to the nearest of the unit value (in centimeters) as 165, 170, 169m 171…. or to the nearest of tenth place of decimals as 165.3, 170.4, 168.9, 170.8…. we may specify class intervals as 160.55- 165.55,165.55 – 175.55,… So that none of the observed values of ‘x’ is equal to any of the class limits.
![]()
Question 3.
Distinguish between a frequency array and a frequency distribution.
Answer:
Frequency Array:
We obtain a frequency array if the variable ‘x’ is discrete and we have frequencies corresponding to each value (there are no…. intervals) let as illustrate with the following examples.
Examples:
A Survey of 100 house holds was carried out to obtain information on their size i.e., the number of members of households. The results of the survey are classified as a frequency array in table below:
Frequency Array of Size of households.
| Size of the households X (1) | Number of household f (2) |
| 1 | 5 |
| 2 | 15 |
| 3 | 25 |
| 4 | 35 |
| 5 | 10 |
| 6 | 5 |
| 7 | 3 |
| 8 | 2 |
| Total | 100 |
The coloumn (1) of the table gives the values which the variable x (size of the households) takes, and column (2) gives the corresponding frequencies (number of households) Thus, there are 5 households whose size is 1, there are 15 households of size 2, and so on.
Frequency Distribution:
The largest value of ‘x’ is B and smallest values is A. Then X = B – A is total range of X. A large range indicates that the values of ‘x’ are spread over a large interval or the variation of value of ‘x’ is large A small range indicates smaller variation in the values of ‘x’. Thus, the range is measure of variation (or dispersion) of ‘x’.
For example:
Suppose we have data on monthly income of 10,000 individuals, the maximum of which is Rs. 50,000 and minimum is Rs. 1,000 Thus, the range is Rs. 49,000. We observe that majority of individuals say, 70% have small incomes close to Rs. 5000 and minority, say 2% have income close to Rs. 30,000.
In order to get a better idea about the distribution of values within the range, we should subdivide the total range into a number of class intervals and find out the number of values in different classes.
Question 4.
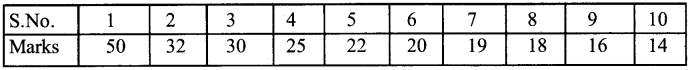
What is meant by individual series? Give one example.
Answer:
Individual Series:
Under this method, the value of all the units are shown separately. The following example will illustrate this:
Example: The marks obtained by 10 students in statistics are following:
The individual series may be arranged in following two orders:
a) Ascending orders:
When data are arranged in ascending order i.e., a small value to a big value it is known as arranging them in ascending order. The figures of above example may be arranged in ascending order as follows:
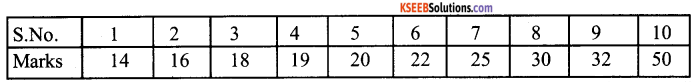
b) Descending orders:
When data are arranged serially starting from a big value to small value it is known as the arrangement of data in descending order.
![]()
Question 5.
What is meant by discrete series? Give the examples.
Answer:
In these series all the items are divided in certain groups, but these groups are not continous therefore these series are known as discrete series. The numbered item that fall in very group are shown in each group which are known as frequencies. The following examples will illustrate this.
Examples:
i) Discrete series in Ascending Order:
ii) Discrete sries in Descending Order:
Question 6.
What is meant by continuous series? Give example
Answer:
Under such series all the variables are divided in certain continuous groups and their respective frequencies will be written with them the following example will clear the form of such series.
Example:
Following are the eiements of a continous series:
1. Class Intervals:
These are the measurement which some problems is measured and wirteen in continuous grup. In the above exaple (0-5), (5-10) etc are the class intervals of the series.
2. Limits of class intervals:
Each class interval figure is known as limits of class interval. Small figures class intervals are known as lower limit class interval. In class interval (0-5) O is lower limit and 5 is a upper limit of tins class interval.
3. Magnitude of class intervals:
The difference between upper limit and lower limit of a class interval (0-5),5 is the magnitude.
6. Mid Value:
The average of two limits of the class interval is known as mid value e.g., the mid value of the class interval 0-5 will be \(\frac{0+5}{2}\) = 2.5
5. Frequencies:
Number of repetition of items of various class intervals in the universe is known as frequencies wliich will be written with them.
Exclusive and Inclusive continuous series,
a. Exclusive series:
Where the value of upper limit is not included in the same group. But will be included in next group, it is known as exclusive series e.g.
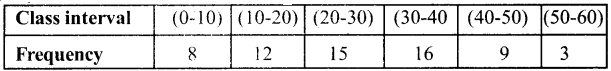
In the above series, 10, 20, 30, 40, 50 and 60 will not be included in first, second, third, fourth fifth and sixth group respectively.
b. Inclusive series:
Where values of upper limit is included in the same group, it is known as inclusive series e.g.
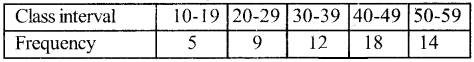
In the above series, value 19,29,39,49, 59 will be included in the same groups in which they are written, therefore, this series will be known as inclusive series.
![]()
Question 7.
Differentiate between absolute errors and relative errors.
Answer:
1. Absolute errors:
Absolute error is the difference between the true and estimated value
Absolute error = actual value – estimated value
2. Relative errors:
It is the ratio of obsolute error to the estimated value. It is found out by dividing the absolute error by the estimated error.
\(Relative Error =\frac{\text { Actual value – Estimated value }}{\text { Estimated error }}\)
Example:
If the actual value is 400 & estimated value is 350
Absolute error = actual error – estimated value = 400 – 350 – 50
Relative error = 50/350 = 0.14
The relative error can also be expressed as percentage of 100.
Question 8.
What is open-end series?
Answer:
In some series the lower class limit of the first class interval and the upper limit of the last class interval are missing, “less than” or below is specified in place of he lower class limit of the first class interval and “more than” or below is specified in place of the lower class limit of the first class interval and ‘more than’ or above is specified in place of the upper class limit of the last class interval.
Example:
| Marks | Frequencies |
| Below 5 | 2 |
| 5- 10 | 6 |
| 10- 15 | 8 |
| 15 and above | 12 |
Question 9.
What is cumulative frequency series? Give an example?
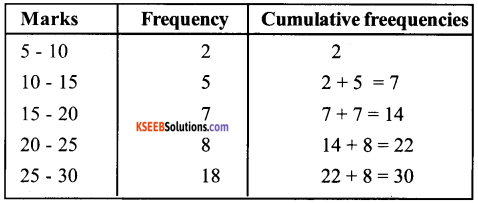
Answer:
Cumulative frequency series is that series in which the frequencies are continuously added corresponding to each class interval in the series. The frequencies that become cumulative frequencies. The cumulative frequency for the first class interval is the same as frequency itself.
But for the second class interval the cumulative frequency for the first class interval is the same as frequency itself. But for the second class interval the comulative frequency would be the both the second as well as first class intervals, e.g.
![]()
Question 10.
How will you convert the cumulative frequency series into simple frequency series? Give an example
Answer:
Cumulative frequency series may be converted into simple frequency series in the following mannner:
| Marks | No. of Student |
| less than 10 | 8 |
| 20 | 40 |
| 30 | 80 |
| 40 | 96 |
| 50 | 100 |
Conversion into simple frequency table from cumulative frequency series simple frequency series.
| Marks less than | No. of students |
| 10 | 8 |
| 20 | 40 |
| 30 | 80 |
| 40 | 96 |
| 50 | 100 |
Question 11.
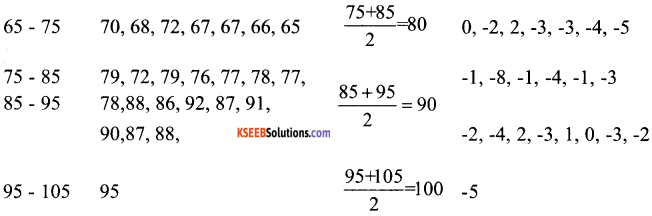
In an entrance examination, for admission to the engineering course of a certain university, the top 50 students, who were selected, got the following percentage of marks in the aggregate:
Answer:
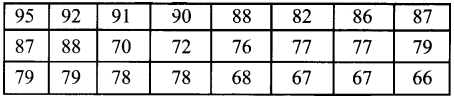
i) Range = L – S[L = Largest, S = Smallest] =95% – 50% = 45%
ii)
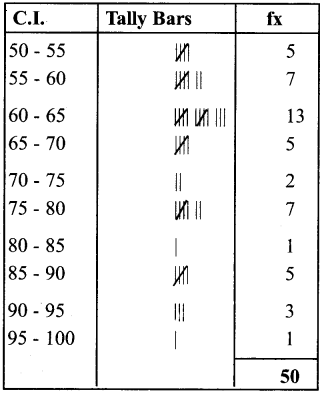
iii) Error of grouping as per (ii) (a)
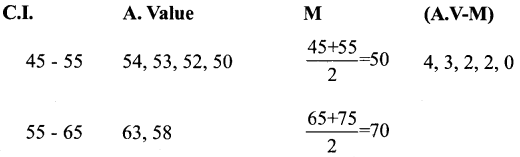
![]()
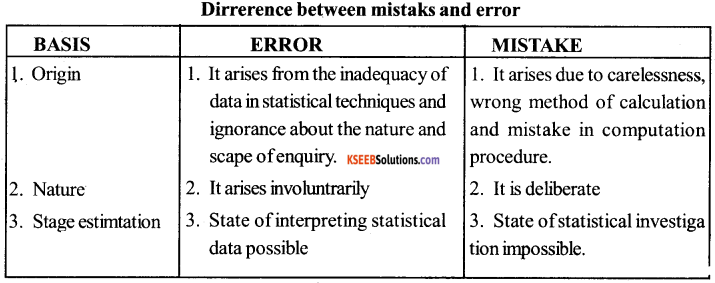
Question 12.
Distinguish between error and mistake.
Answer:
Statistical Error:
Term error is used in statistics in a technical sence. It is the difference between the estimated or approximated value and the true value.
Mistake:
The mistake arises because of miscalculations, use of wrong methods of calculations and wrong interpretation of the result these may arise due to the unrepresentative character of the data.
Question 13.
Distinguish between
- Continuous and
- Discrete variables.
Answer:
1. Continuous variable:
If a variable can take any numerical value within a certain range, it is called continuous variable. It passes one value of the next.
2. Discrete variables:
If a variable can take only some particular value, it is called discrete variable. There are gaps between one value and the next possible one.
Example: continuous series:
Example: Discrete series:
![]()
![]()
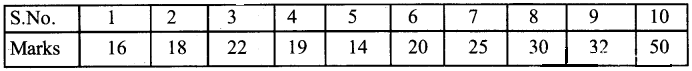
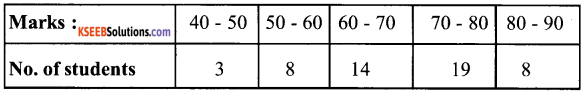
Question 14.
Explain the following terms: Frequency distribution, class frequency, class limits, class interval, classmark, frequency curve.
Answer:
1. Frequency distribution:
It is a comprehensive way to classify raw data of a quantitative variable. It shows how the different values of a variable are distributed in different classes along with their class frequencies.
2. Class frequency:
It means the number of values in a particular class.
3. Class limit:
Each unit in a frequency distribution table is bounded by class limits class limits are the two ends of a class. The lowest value is called the lower class limit and the highest value, the upper class limit.
4. Class Interval:
Class interval or class width is the difference between the upper class limit and the lower class limit.
5. Class mark:
The class midpoint or class mark is the middle value of a class. It lies half way between the lower class limit and the upper class limit of a class.
6. Frequency curve:
It is a graphic representation of a frequency distribution To obtain the frequency curve we plot the class marks on the X-axis and frequency on the Y-axis.