Students can Download Economics Chapter 6 Measures of Dispersion Questions and Answers, Notes Pdf, 1st PUC Economics Question Bank with Answers helps you to revise the complete Karnataka State Board Syllabus and score more marks in your examinations.
Karnataka 1st PUC Economics Question Bank Chapter 6 Measures of Dispersion
1st PUC Economics Measures of Dispersion TextBook Questions and Answers
Question 1.
A measure of dispersion is a good supplement to the central value in understanding a frequency distribution comment.
Answer:
A measure of dispersion:
A good supplement to central value: A central value condences the series into a single figure. The measure of central tendencies indicate the central tendency of a frequency distribution in form of an average. These averages tell us something about the general level of the magnitude of the distribution, but they fail to show anything further about the distribution. The averages represent the series as a whole.
One may now be keen to know how for the various values of the series tend to dispense from each other or from their averages. This brings us to yet another important brand of statistical methods, viz measures of dispersion. Only when we study dispersion along with average of series that we can have a comprehensive information about the nature and composition of a statistical series.
In a country, the average income or wealth maybe equal. Yet there maybe great disparity in its distribution. As a residt, there of, a majority of people may be below the poverty line. There is need to measure variation in dispersion and express it as a single figure, it can be further explained with an example.
Below are given the family’s incomes of Ram, Rahim and Maria. Ram, Rahim and Maria have four, six and five members in their families respectively.
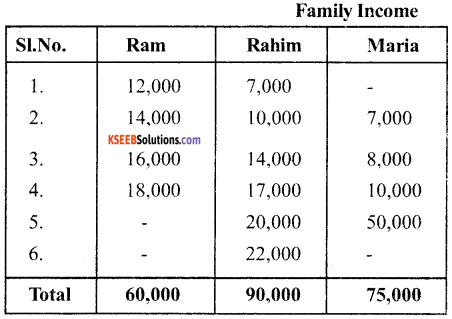
From the table use come to know that each family have average income of Rs. 15,000
But there are considerable differences in individual methods. It is quite obvious that averages try to tell only one aspect of a distribution i.e. representative size of values, to understand it better, we need to know the spread of values also. The Ram’s family, differences in incomes are comparatively lower.
In Rahim’s family, differences are higher and Maria’s family differences are the highest. Knowledge of only average is sufficient. A measure of dispersion improves the understanding of the distribution series.
![]()
Question 2.
Which measure of dispersion is the best and how?
Answer:
Standard deviation is the best measures of dispersion, because it Posseses’s most of the characterstics of an ideal measures disperrsion.
Question 3.
Some measures of dispersion depend upon the spread of values where as some calculate the variation of values from a control value. Do you agree?
Answer:
Yes, we agree with the statement. Range and quartile deviation measure the dispersion by calculating the spread within which the values lie ie., they depend on the spread of value. On the other hand, mean deviation & standard deviation calaculate the variation of value from a central value.
Question 4.
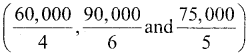
In a town 25% of the persons earned more than Rs. 45000, where as 76% earned more than Rs. 18000. Calculate the absolute & relative values of dispersion.
Answer:
1. Absolute value of dispersion ie.
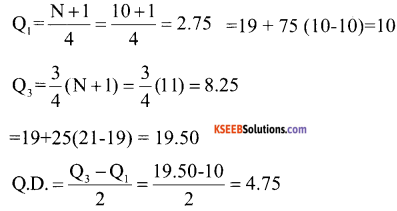
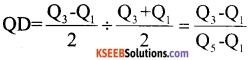
Quartile deviation = \(\frac{\mathrm{Q}_{3}-\mathrm{Q}_{1}}{2}=\frac{45000-18000}{2}\) = 13500
2. Relative Value of dispersion ie., coefficient of
Quartile deviation =
Question 5.
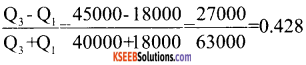
The yield of wheat and rice per acre for 10 districts of a state is as under:
Calculate for each crop:
i) Range
ii) Q.D
iii) Mean Deviation about mean
iv) Mean Deviation about Median
v) Standard Deviation
vi) Which crop has greater variation
vii) Compare the values of different measures for each crop.
Answer:
WHEAT
i) Range = L – S
= 25 – 9
=16
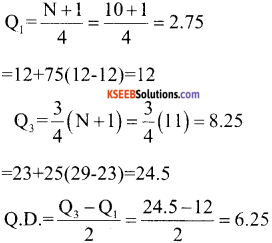
ii) Qusirtile Deviation (Q.D)
Data in ascending order
9, 10, 10, 12, 15, 16, 18, 19,21,25
iii) Mean Deviation about mean
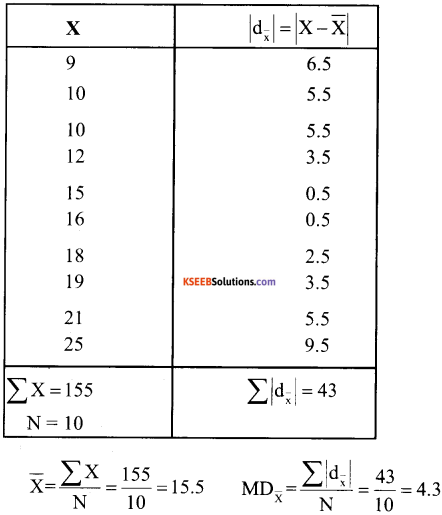
![]()
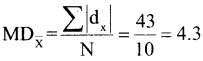
iv) Mean Deviation about mean
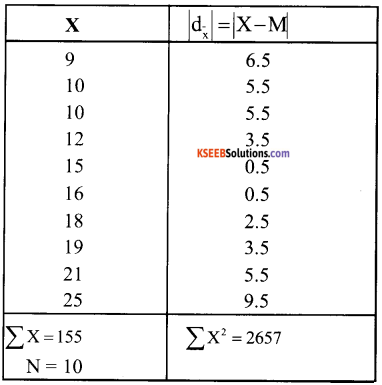
Median (M) \(=\frac{N+1}{2}=\frac{10+1}{2}=\frac{11}{2}\)
= 5.5 th item
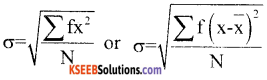
v) Standard Deviation
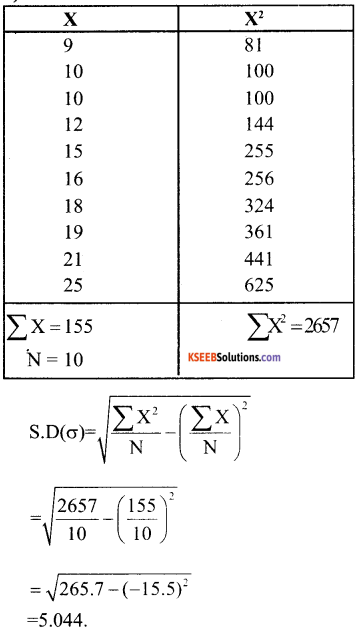
vi) Coefficient of Variation
\(\mathrm{C.V}_{\mathrm{w}}=\frac{\sigma}{\mathrm{X}} \times 100\)
= \(\frac{5.044}{15.5}\) × 100
= 32.54
Rice:
- Range = L – S = 34 -12 = 22
- Quartile Deviation Q.D.
Data in ascending order 12, 12, 12, 15, 18, 18, 22, 23, 29, 34
iii) Mean Deviation about mean
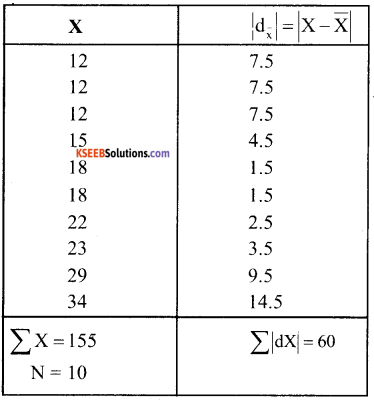
iv) Mean Deviation about median
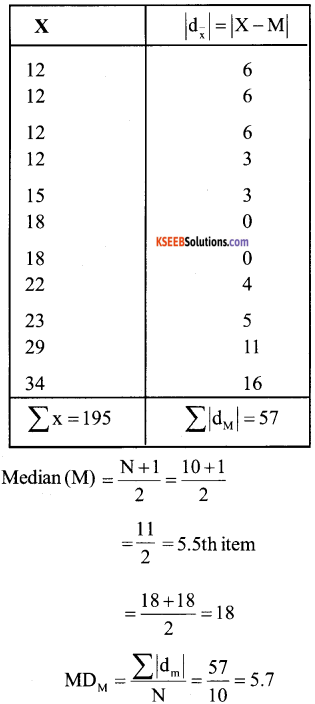
v) Standard Deviation
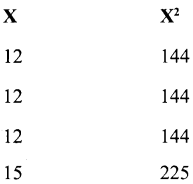
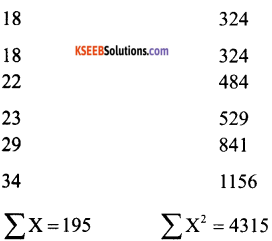
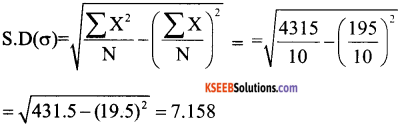
vi) Coefficient of Variation
C. Vw = \(\frac{\sigma}{\mathrm{X}}\) × 100 = \(\frac{7.158}{19.5}\) × 100 = 636.70
Since coefficient of variation of Rice is more, therefore, Rice crop has greater variation.
![]()
vii) Comparison of the values of different measures:
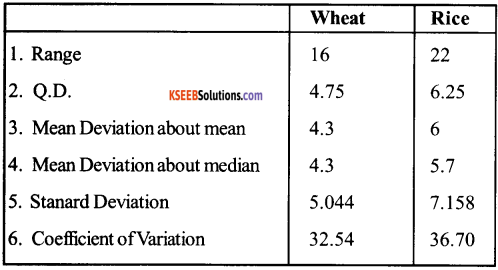
Question 6.
In the previous question, calculate the relative measures of variation and indicate the value, which in your opinion is more reliable.
Answer:
Coefficient of range is the relative measure of range. Hence we will calculate coefficient of range.
Coefficient of Range of wheat.
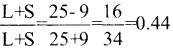
Coefficient of Range of Rice.
Question 7.
A batsman is to be selected for a cricket team. The choice is between X and Y on the basis of their five previous scores which are:
| X | Y |
| 25 | 50 |
| 85 | 70 |
| 40 | 65 |
| 80 | 45 |
| 120 | 80 |
Which batsman should be selected if we want
- a higher run getter or
- a more reliable batsman in the team?
Answer:
Batsman – X
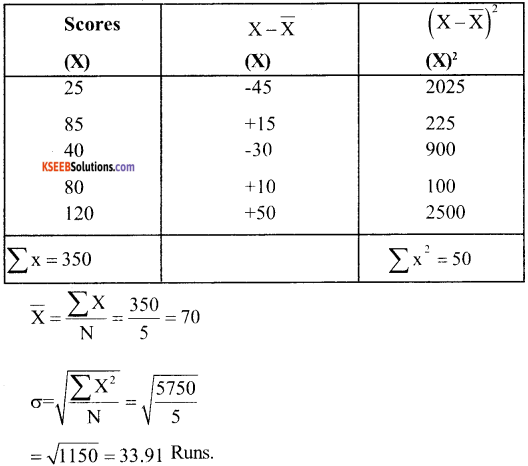
Coefficient of S.D. = \(\frac{\sigma}{\bar{X}}=\frac{33.90}{70}\) = 0.484
Variance = \(\frac{\sum X^{2}}{N}=\frac{5750}{5}\) = 1150 Runs
Coefficient of Variance = \(\frac{33.91}{70}\) × 100 = 48.44%
Batsman – Y
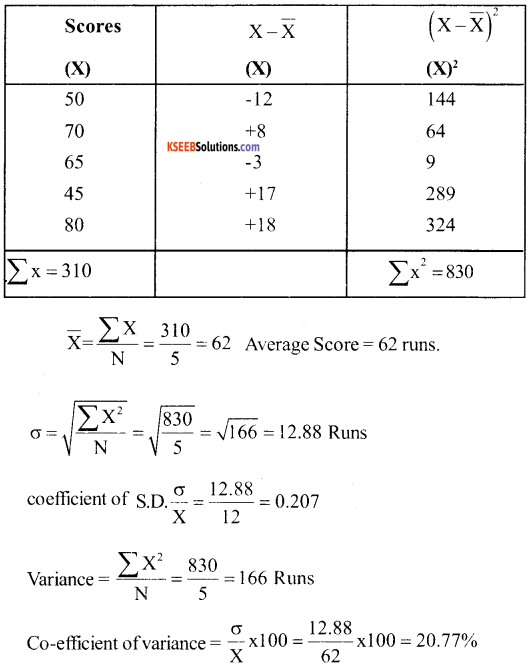
![]()
Question 8.
To check he quality of two breands of light bulbs, their lie in burning hours was estimated as under for 100 bulbs of each brand.
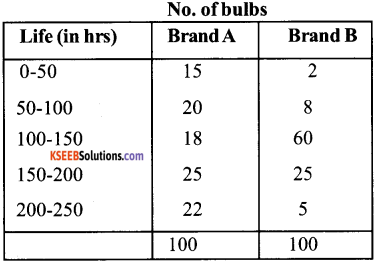
- Which brand gives higher life?
- Which brand is more dependable?
Answer:
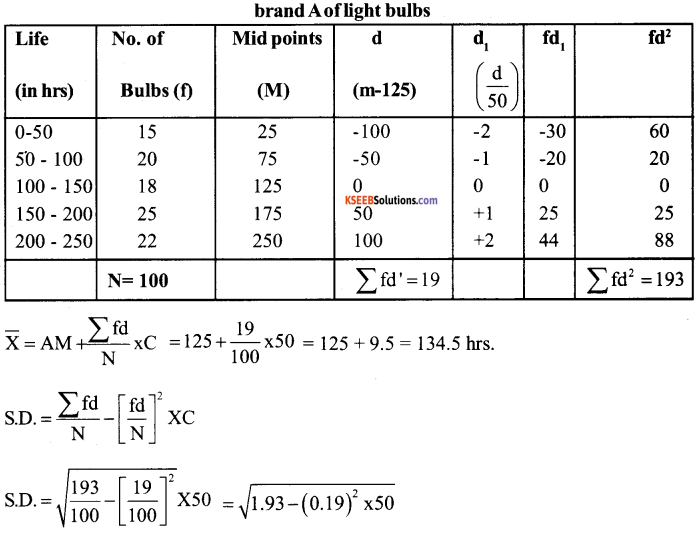
= \(\sqrt{1.8939 \times 50}\) = 1.376 × 50 = 68.8 hrs
CVA = \(\frac{\sigma A}{\bar{X} A}\) × 100 = \(\frac{68.8}{134.5}\) × 100 CVA = 51.15%
AM = 125
C = 50
= 37.32 hrs
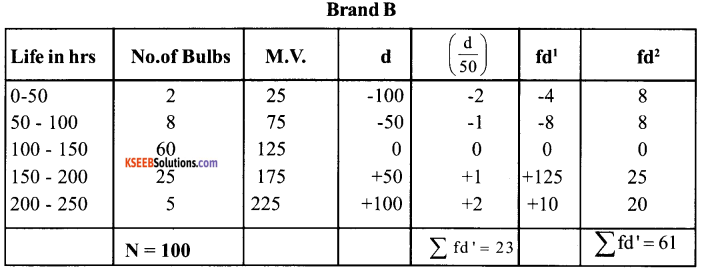
CVB = \(\frac{\sigma \mathrm{B}}{\overline{\mathrm{X}} \mathrm{B}}\) × 100
= \(\frac{37.62}{136.5}\) × 100 = 27.34%
1. Since the average life of bulbs of Brand B (136.5) is greater that of Brand A (134.5hrs) therefore the bulbs of Brand B gives a higher life.
2. Since C.V. of bulbs of Brand B (27.34%) is less than that of Brand A (51.55), therefore the bulbs of brand B are more dependable.
Question 9.
Average daily wager of 50 worker of a factory was Rs. 200 with a standard deviation of Rs. 40. Each worker is given a raise of Rs. 20, What is the new average daily wage and standard deviation? Have the wages become more or less uniform?
Answer:
Increase in each worker wages = Rs. 20
Total Increase in wages = 50 × 20 = Rs. 1000
Total of wages before increase worker in wagers = 50 × 200 = Rs. 1000
Total wages after increase in wages = 10000 + 1000 + Rs. 11000
New Average wage
Hence, mean wages will be affected but standard deviation will not be affected are the stndard deviation is independent of origin. Have the wages become or less uniform? In order to calculate uniformity wages, we will have to calculate co-efficient of variation.
Afterwards
Now more uniformity in wages has taken place.
![]()
Question 10.
If in the previous question, each worker is given a hike of 10% in wages, how are the mean and standard deviation values affected?
Answer:
When each worker is given a hikes of 10% in wages both the mean and standard deviation values will be affected.
New Mean = Rs. 200 + 10 % of Rs. 200
= Rs. 200 + \(\frac{10}{100}\) × 200 = Rs. 220
New Standard Deviation
= Rs. 40 + 10% of Rs. 40 = Rs. 40 + \(\frac{10}{100}\) × 40 = Rs. 44.
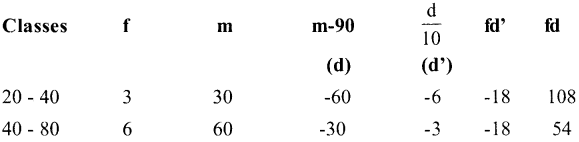
Question 11.
Calculate the mean deviation about mean and standard deviation for the following distribution:
| Classes | Frequencies |
| 20 – 40 | 3 |
| 40 – 80 | 6 |
| 80 – 100 | 20 |
| 100 – 120 | 12 |
| 120 – 140 | 9 |
| 50 |
Answer:
Calculation of mean deviation about mean:
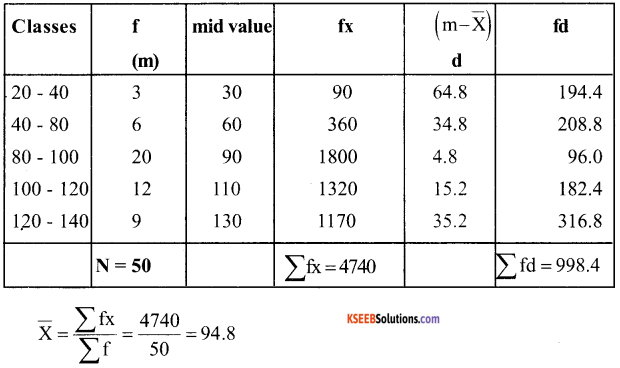
Mean Deviation from A.M. = \(\frac{\sum \mathrm{fd}}{\sum \mathrm{f}}=\frac{998.4}{50}\) = 19.96
Calculation of standard deviation from mean:
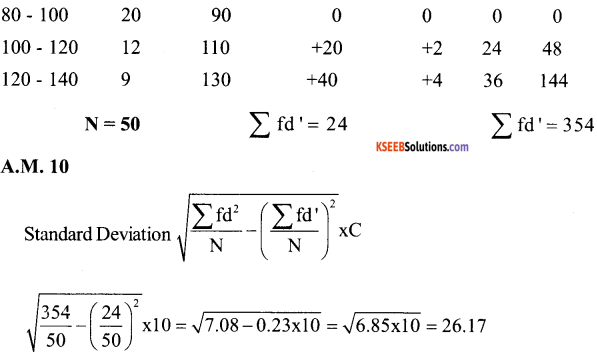
Question 12.
The sum of 10 Values is 100 and sum of their squares is 1090. Find the coefficient of Variation
Answer:
Given N-10, Σ X = 10, Σ X2 = 1090
Coefficient of variation = 30
1st PUC Economics Measures of Dispersion Additional Questions and Answers
1st PUC Economics Measures of Dispersion Very Short Answer Type Questions
Question 1.
Define disperation.
Answer:
Dispersion measures the extent to which different items tend to dispersion away from the central tendency.
Question 2.
How many methods are there to calculate dispersion?
Answer:
Following are the methods of absolute and relative measures of dispersion:
i) Absolute measure: Range, quartile deviation, mean deviation, standard deviation and Lorenz curve.
ii) Relative measure – Coefficient of range, coefficient of quartile deviation, coefficient of mean deviation, standard deviation, coefficient of variation.
Question 3.
Define range.
Answer:
Range is the difference between the highest value and lowest value in a series.
![]()
Question 4.
Define quartile deviation.
Answer:
Quartile deviation is half of Inter quartile Range.
Quartile Deviation \(\frac{\mathrm{Q}_{3}-\mathrm{Q}_{1}}{2}\)
Question 5.
How is coefficient of quartile deviation calculated?
Answer:
Coefficient of quartile deviation is calculated by using the following formula: Coefficient of
Question 6.
Define mean deviation
Answer:
Mean deviation is the arithmetic average of the deviation of all the values taken from some average value (mean, median, mode) of the series, ignoring sign (+or-) of the deviations.
Question 7.
Define standard deviation
Answer:
Standard deviation is the square root of the arithmetic mean of the squares of deviation of the items from their mean value.
Question 8.
Give formula to calculate standard deviation of a frequency distribution series by direct method.
Answer:
\(\overline { X } \quad =\quad \frac { \sum { f\left( x \right) } }{ N }\) SD or \(\sqrt{\frac{\sum f_{x}^{2}}{N}}\)
Where x = x – \(\overline { X }\)
x = deviation
x = mid value
\(\overline { X }\) = Mean value
Question 9.
What is Lorenz curve?
Answer:
Lorenz curve is a measure of deviation of actual distribution from the line of equal distribution.
Question 10.
What do you mean by coefficient of variation?
Answer:
Coefficient of variation is a percentage expression of standard deviation. It is 100 times the coefficient of dispersion based on standard deviation of a statistical series.
C.V = \(\frac{\sigma}{\overline{\mathrm{x}}}\) × 100
Question 11.
Given formula of standard deviation for discrete series.
Answer:
![]()
Question 12.
Give formula of mean deviation through mean for individual series. Mean deviation through mean for individual series.
Answer:
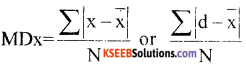
where x = – \(\overline { X }\)
Deviation from the arithmetic
average
N = No of Items
Question 13.
What is standard deviation?
Answer:
Standard deviation is the positive square root of the mean of squared deviation from mean S.D. is always calculated on the basis of mean only.
Question 14.
What is Variance?
Answer:
Variance is the square of standard deviation. In Equation Variance = (SD)2
Question 15.
Name the four methods available for the calculation of standard deviation of individual series.
Answer:
- Actual mean method
- Assumeed mean method
- Direct method & step deviation method.
Question 16.
Write down the formula for calculating standard deviation directly.
Answer:
\(\sigma=\sqrt{\frac{\sum x^{2}}{n}-(\bar{x})^{2}}\)
Question 17.
Which formula is used for calculating standard deviation of individual series by step deviation method.
Answer:
\(\sigma=\sqrt{\frac{\sum \mathrm{d}^{2}}{\mathrm{n}} \times \mathrm{C}}\)
Question 18.
What is dispersion?
Answer:
The degree to which numerical data spread about an average value is called the variation of dispersion. It is an average of second order.
Question 19.
What is measure of dispersion?
Answer:
The measure of the deviation of the size of items from an average is called a measure of dispersion.
Question 20.
Name the important measure of dispersion?
Answer:
Range Quartile deviation, mean deviation and standard deviation arc the important measures of dispersion.
Question 21.
Define the range
Answer:
The range is defined as the difference between the largest and the smallest value of variable in the given set of value R = L – S.
Question 22.
Define quartile deviation.
Answer:
Quartile deviation is defined as: \(\frac{\mathrm{Q}_{3}-\mathrm{Q}_{1}}{2}\)
Question 23.
What is the Variance?
Answer:
Variance is the square of standard deviation. In equation, variance = \((\sigma)^{2}\)
![]()
Question 24.
What is the difference between Variance and standard deviation?
Answer:
The Variance is the average squared deviation from mean and standard deviation is the square of Variance.
Question 25.
Write down the Unique feature of mean deviation.
Answer:
Mean deviation is the least when taken about median.
Question 26.
What is Coefficient of Variation?
Answer:
Coefficient of Variation is the percentage Variation in the mean, the standard being treated as the total Variation in the mean.
Question 27.
Write down the formula of calculating Coefficient of Variation
Answer:
C.V = \(\frac{\sigma}{\overline{\mathrm{x}}}\) × 100
Question 28.
What is a Lorenz Curve?
Answer:
Lorenz Curve is a curve which measures the distribtution of wealth and income. Now it is also used tar the study of the distribution of profit wages etc.
Question 29.
What does higher value of range imply?
Answer:
Higher value of range implies higher dispersion.
Question 30.
How do Range and Quartile deviation measure the dispersion?
Answer:
Range and quatile deviation measure the dispersion by calculating the spread within which the values lie.
Question 31.
Which aspect of distribution is indicated and which is not indicated by the average.
Answer:
Average try to tell only one aspect of a distribution ie. a representative size of the Value. It does not tell us the spread of values.
![]()
Question 32.
Name the measures based on the spread of values
Answer:
Range and Quantile deviation based on the speread of values.
Question 33.
Give two limitation of Range.
Answer:
1. Range is unduly affected based on the spread of values.
Question 34.
Calculate the range of the following observations :
20, 25, 29, 30, 35, 39, 41, 48, 51, 60 & 70
Answer:
Range = L – S = 70 – 20 = 50
Question 35.
Name the measures of dispersion from average.
Answer:
Mean deviation and standard deviation are the measure of dispersion from average.
Question 36.
How is standard deviation independent of origin?
Answer:
Standard deviation is independent of origin as it is not affected by the Value of constant from which deviations are calculated. The value of the constant does not figure in the standard deviation formula.
Question 37.
What are open ended distribution?
Answer:
Open ended distributions are those distribution in which either the lower limit of the lower class or the upper limit of the highest class or both are not specified.
Question 38.
What is the main limitation of range?
Answer:
Range is unduely uneffected by extreme range.
Question 39.
Calculate range from the following date:
20, 25, 29, 30, 70,100
Answer:
Range = 100 – 20 = 80
![]()
Question 40.
In a town 25% of person earned more than Rs. 45000 where are 75% earned more than Rs. 18000 calculate absolute Value of dispersion.
Answer:
Absoluite value ofdispersioa (Quartile value of deviation)= \(\frac{\mathrm{Q}_{3}-\mathrm{Q}_{1}}{2}=\frac{45000-18000}{2}\) = 13500
1st PUC Economics Measures of Dispersion Short Answer Type Questions
Question 1.
Illustrate the meaning of the term dispersion with example.
Answer:
Dispersion is a measure of the Variation of the items. According to Prof. C.R. Conn, Dispersion is a measure of the extent to which the individual item vary. The measures of dispersion are required to measure the amount of variation of values about the central values.
Example:
Suppose the monthly incomes in rupees of five households are as Rs. 4500, 6000, 5500, 3750 and 4700
The arithmatic mean of income is Rs. 4700. The amount of Variation in income is shown by deviation from the central values. In this case the deviation from the arithmean. are Rs. 390, 110,610,1140 & 190. Deviation being considered as the total Variation in the mean.
Question 2.
What are the properties of a good measure of dispersion?
Answer:
Properties of a good measure of disperison.
- It should be based on all the observation.
- It should be readily comprechensible.
- It should be fairly & easily understood.
- It should be medable to further algebric treatment.
- It should be affected as little as possible by fluctuation in sampling.
Question 3.
Give the absolute and relative measures dispersion.
Answer:
Absolute Measure:
- Range
- Quartile deviation
- Mean deviation
- Standard deviation
Relative Measure:
- Coefficient of Range
- Coefficient of quartile deviation
- Coefficient of mean deviation
- Coefficient of standard deviation.
Question 4.
Write down the steps involved in the calculation of mean deviation in case of discrete series.
Answer:
Steps involved in the calculation of mean deviation:
Following steps are involved in the calculation of mean deviation.
- Find out the mean / median / mode of a series.
- Find out the deviation of different items from mean /median /mode
- Add the deviations ignoring positive & negative signs. Treat all deviations as positive.
- Calculate mean deviation by dividing the sum total of the deviation by the number of items.
![]()
Question 5.
Write down the steps involved in the calculation of mean deviation for the discrete series.
Answer:
Steps
- Find out central tendency of the series (mean or median) from which deviations are to be taken.
- Take from central tendency ignoring signs (+, -) express it as | dx | Or (|dm|)
- Multiply each deviation value by frequency facing it.
- Add the multiplies & express it as \(\sum \int(\mathrm{d})\)
- Divide \(\sum \int(\mathrm{d})\) by sum total of frequency.
The resuttant value will be mean deviation.
Question 6.
Write down the features of mean deviation.
Answer:
Features of mean deviation.
- Mean deviation is rigidly defined.
- It depends on all the values of the variable.
- It is based on absolute deviation from central values.
- It is easy to understand.
- It involves a harder calculation than the range & quantile deviation.
- It is amendable to algebraic treatment.
- The units of measurement of the mean deviation are the same as there of the variable.
Question 7.
Differentiate between mean deviation & Standard deviation.
Answer:
Difference between mean deviation and standard deviation.
Mean Deviation:
- In calculating mean deviation algebric signs are ignored.
- Mean or Median is used in calculating the mean deviation.
Standard Deviation:
- In calculating standard deviation, algebraic signs are taken into account.
- Only mean is used in calculating the standard deviation.
![]()
Question 8.
What are the uses of co-efficient of Variation?
Answer:
Coefficient of Variation is used to compose the variability, homogeneity, stability and uniformity of two different statistical series. Higher value of co-efficient variation suggests greater degree of variation & lesser degree of stability. On the other hand, a lower value of coefficient variation suggests lower degree of variability & higher degree of stability, uniformity, homogeneity ‘and consistency.
Question 9.
Explain merits & demerits of Quartile Deviation?
Answer:
Merits:
- It is easy understand and to calculate.
- It is unaffected by the extreme values.
- It is quite satisfactory when only the middle half of the group is dealt with.
Demerits :
- It is not capable of algebraic treatment
- It ignores 50 percent of the extreme items.
- This is not useful when extreme items are to be given special height.
Question 10.
Write down the merits of mean deviation?
Answer:
Merits:
- It is easy to understand mean Deviation.
- Mean Deviation is less affected by extreme value than the Range.
- Mean deviation is based on all the items of the series: It is therefore, more representative than the range quartile Deviation.
- It is very simple & easy measure of dispersion
Demerits of Mean Deviation :
- Mean deviation is not capable of algebraic treatment, because it ignores plus and minus signs.
- It is not a well – defined measure since mean deviation from different, average (Mean, median & mode) will not be same.
![]()
Question 11.
The height of 11 men were 61, 64, 68, 69, 67, 68, 66, 70, 65, 67 and 72 inches. Calculate the range If the shortest man is omitted, what is the percentage change in the range?
Answer:
1. Range = L = S = 72 – 61 = 11 inches.
2. New Range (Shortest man is omitted)
= L – S = 72 – 64 = 8
change in range =11 – 8 = 3 inches
Percentage change in range = 3/11 × 100 = 27.2%
Question 12.
What will be the effect of change of origin and change of scale on the standard deviation, mean & variance?
Answer:
Change of origin & change of scale: Following are the effects of change of origin and change of scale on the mean, standard deviation and variance.
1. Any constant added or substracted (Change of origin) than the standard deviation of original data and of change data after addition as substraction will not change but the mean of new data will change.
2. Any constant multiplied are divided (change of scale) then mean, standard deviation and variation will change of the new changed data.
Question 13.
How is dispersion of the series different from average of the series?
Answer:
Average of the series refers to the central tendency of the series. It represents behaviour of all the items in the series. But different item tends to different from each other and from and from the averages. Dispersion measures the extent to which different items tend to disperse away from the central tendency.
Question 14.
Why should we measure dispersion about some particular value?
Answer:
We should measure dispersion about some particular value because in that case.
1. We can assess how precise is the central tendency observations in the series. Greater value of dispersion implies lesser representativeness of the central tendency and vice versa.
2. We can precisely assess how scattered are the actual observation from their representative value.
Question 15.
The following table gives you the height of 100 person. Calculate dispersion by range method.
| Height in centimeters | No of person |
| Below 162 | 2 |
| Below 163 | 8 |
| Below 164 | 19 |
| Below 165 | 32 |
| Below 166 | 45 |
| Below 167 | 58 |
| Below 168 | 85 |
| Below 169 | 93 |
| Below 170 | 100 |
Answer:
Calculation of dispersion by range method:
| Height in centimeters | No of person |
| 161 – 162 | 2 |
| 162 – 163 | 6 |
| 163 – 164 | 11 |
| 164 -165 | 13 |
| 165 – 166 | 13 |
| 166 – 167 | 13 |
| 167 – 168 | 27 |
| 168 – 169 | 8 |
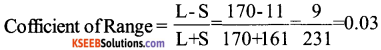
| 169 – 170 | 7 |
| Total | 100 |
Range = L – S = 170 – 161 =9
1st PUC Economics Measures of Dispersion Long Answer Type Questions
Question 1.
Give the comparison of alternative measure of dispersion.
Answer:
Comparison of alternative measure of the dispersion has been discussed below.
1. Rigidly defined:
All the four measures the range, quartile deviation, mean deviation & standard deviation are rigidy defined. There is no Vagueness in their definitions.
2. Ease of calculation:
The range is the easiest one to calculate. Quartile deviation requires calculation of the upper & lower quartiles but that is also easy enough. However, the mean deviation & standard deviation require a little more systematic calculation they, too are easy.
3. Simple interpretaion:
All measures of dispersion are easy to interpret. While the range and quartile deviation measure disperrsion in a general way the mean deviation and standard deviation measure dispersion in terms of deviation from a central value. Thus the mean deviation and standard deviation give a better idea about the dispersion of values within the range.
4. Based on all values:
The range and Quantile deviation do not depend on all values where as the mean deviation and standard deviation use all values of the variable the range is affected the most by extreme values.
5. Amendable to algebraic treatment:
The standard deviation is perhaps the earliest for analytical work. Other measure can be also dealt with analytically but derivation are harder.
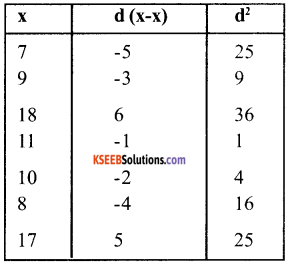
Question 2.
A variable ‘x’ takes the following values: 7, 9, 18, 11, 10, 8, 17, 13, 11, 16
Answer:
a. Calculate
i. The arithmetic mean of ‘x’
ii. The standard deviation of the value of ‘x‘
iii. The mean deviation of the value ‘x’ about
![]()
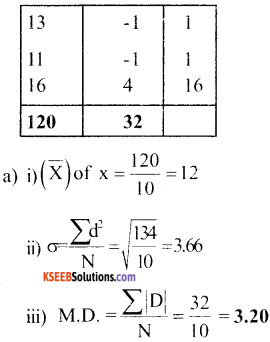
Question 3.
Prove by an example that the Variance is uneffected by the choice of the assumed mean.
Answer:
We take the following example for providing that the variance is uneffected by the choice of the assumed mean.
Example: Calculate variance of 25, 60, 45, 30, 70, 42, 36, 48, 34 and 60 by actual mean assumed mean method.
a. Calculation of variance by Actual mean method
Σ x = 440, \(\overline{\mathrm{X}}=\frac{440}{10}\) = 44
Variance \(\frac{\sum x^{2}}{N}=\frac{1710}{10}\) = 171
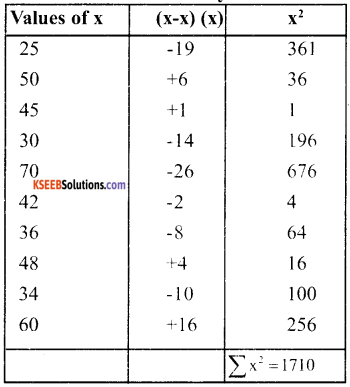
b. Calculation of Variance by Assumed Mean method.
Assumed mean = 45
= 172 = (-1)2 = 172 – (+1) = 172 – 1 = 171
Question 4.
The distribution of the cost of production (in rupees) of a quaintal of wheat in 50 farms is as follows:
| cost (in rs.) | Number off aims |
| 40 – 50 | 3 |
| 50 – 60 | 6 |
| 60 – 70 | 12 |
| 70 – 80 | 18 |
| 80 – 90 | 9 |
| 90 – 100 | 2 |
| Total | 50 |
Answer:
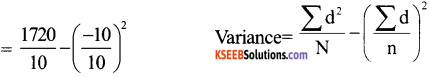
1. Calculate the variance
- By direct method
- By step deviation method & compare your results with the mean deviation about the arithmetic mean.
2. Calculate the coefficient of variations by using
- The standard deviation of costs &
- The mean deviation of cost about the arithmetic mean & compare the two. What is your conclusion about variation of cost.
Solution:
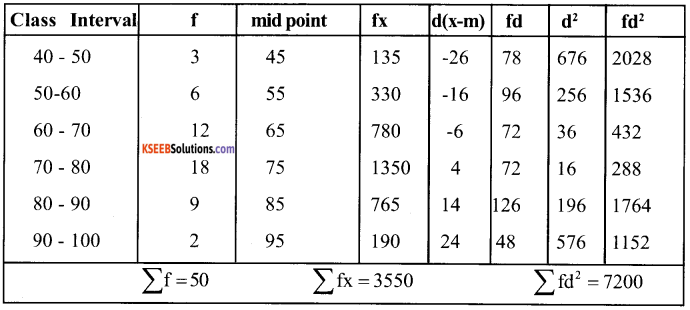
a. Calculation of Variance by step Deviation
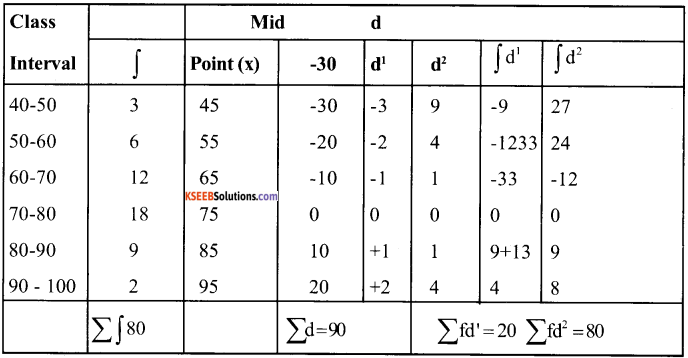
A. M. = 75 i = 10
= \(\sqrt{160-0.16 \times 10}\) = \(\sqrt{1.44 \times 10}\)
= 1.2 × 10 = 12
Variance = σ² = (12)² = 144
b. Calculation of co – efficeient of variation:
1. Variance co – efficent (from S.D.)
= \(\frac{\sigma}{x}=\frac{12}{71}\) = 0.169 or 0.17 approx.
2. Variance co-coefficient (from mean deviation) = \(\frac{\mathrm{MD}}{\mathrm{x}}\)
M.D. = \(\frac{492}{50}\) = 9.84
x = 71
Hence V.C. = \(\frac{9.84}{71}\) = 0.138 = 0.14 approx.
![]()
Question 5.
Briefly explain the various measures calculated from standard deviation?
Answer:
Measures calculated from standard deviation
Mainly following meassures are calculated from standard deviation.
1. Co – efficient of standard deviation:
It is a relative measure of standard deviation. It is calculated to compare the variability in two or more than two series. It is calculated by dividing the standard deviation by arithmetic mean of data symbolically.
Co – efficient of S.D.
Here Standard deviation = \(\frac{\sigma}{\overline{\mathrm{X}}}\) × 100
2. Arithmetic mean.
Co – efficient of variance. It is most populartly used to measure relative variation of two or more than two series. It should the relationship between the S.D and the arithmetic mean expressed in terms of percentage. It is used to compare unifromly, consistency and variability in two different series.
Symbolically C.V = \(\frac{\sigma}{\overline{\mathrm{X}}}\) × 100
3. Variance:
It is the square of standard deviation. It is closely Related to standard deviation. It is the average squared deviation from mean whereas standard deviation is the square root of variance. Symbolically variance = σ²