Students can Download Maths Chapter 15 Statistics Questions and Answers, Notes Pdf, 1st PUC Maths Question Bank with Answers helps you to revise the complete Karnataka State Board Syllabus and score more marks in your examinations.
Karnataka 1st PUC Maths Question Bank Chapter 15 Statistics
Question 1.
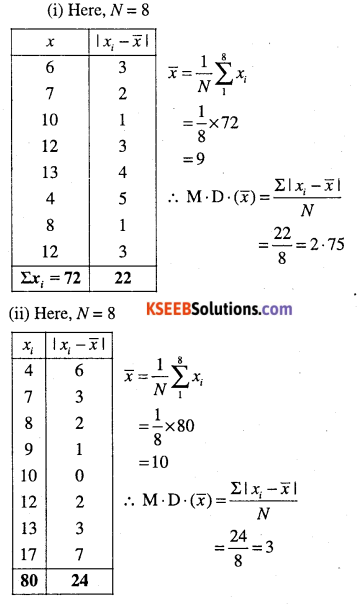
Find the mean deviation about the mean for the following data
(i) 6, 7, 10, 12, 13, 4, 8, 12
(ii) 4, 7, 8, 9, 10, 12,13,17
(iii) 38, 70, 48, 40, 42, 55, 63, 46, 54, 44
Answer:
Question 2.
Find the mean deviation about the mean for the data.
12, 3, 18, 17, 4, 9, 17, 19, 20, 15, 8, 17, 2, 3, 16, 11, 3, 1, 0, 5.
Answer:
Try your self.
\(N=20, \bar{x}=10, \Sigma\left|x_{i}-\bar{x}\right|=124, \mathrm{M} \cdot \mathrm{D} \cdot(\bar{x})=6 \cdot 2\)
![]()
Question 3.
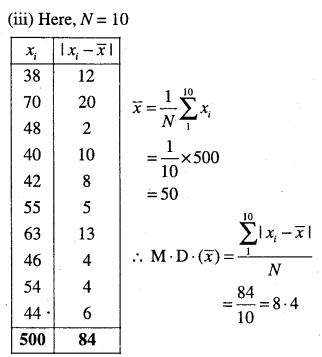
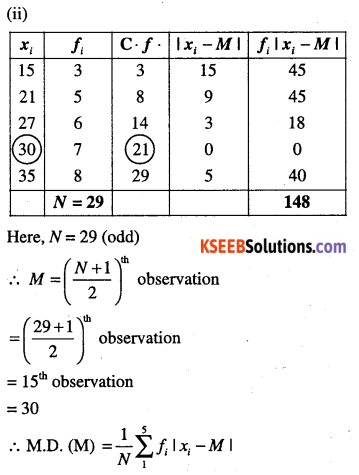
Find the mean deviation about the median for the data:
(i) 13, 17, 16, 14, 11, 13, 10, 16, 11, 18, 12, 17
(ii) 36, 72, 46, 60, 45, 53, 46, 51, 49, 42
(iii) 3, 9, 5, 3, 12, 10, 18, 4, 7, 19, 21
Answer:
(i) Arrange the data in ascending order as
Question 4.
Find the mean deviation about the mean for the following data.
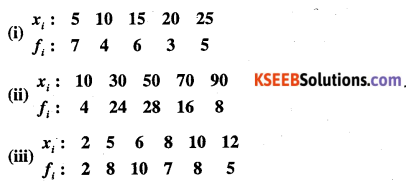
Answer:

![]()
Question 5.
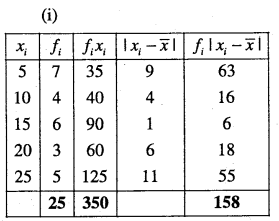
Find the mean deviation about the median for the data,


Answer:
Question 6.
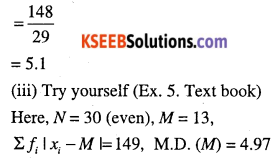
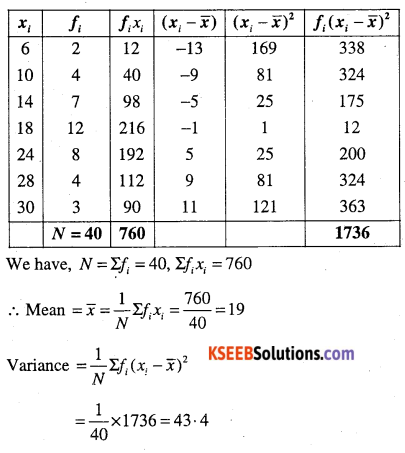
Find the mean deviation about the mean for the following data.
(i)
| Income per day | Number of persons |
| 0 – 100 | 4 |
| 100 – 200 | 8 |
| 200 – 300 | 9 |
| 300 – 400 | 10 |
| 400 – 500 | 7 |
| 500 – 600 | 5 |
| 600 – 700 | 4 |
| 700 – 800 | 3 |
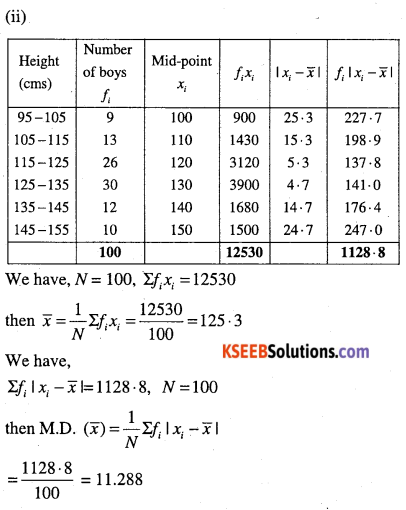
(ii)
| Height (cms) | Number of boys |
| 95 – 105 | 9 |
| 105 – 115 | 13 |
| 115 – 125 | 26 |
| 125 – 135 | 30 |
| 135 – 145 | 12 |
| 145 – 155 | 10 |
![]()
(iii)
| Marks obtained | Number of students |
| 0 – 10 | 12 |
| 10 – 20 | 18 |
| 20 – 30 | 27 |
| 30 – 40 | 20 |
| 40 – 50 | 17 |
| 50 – 60 | 6 |
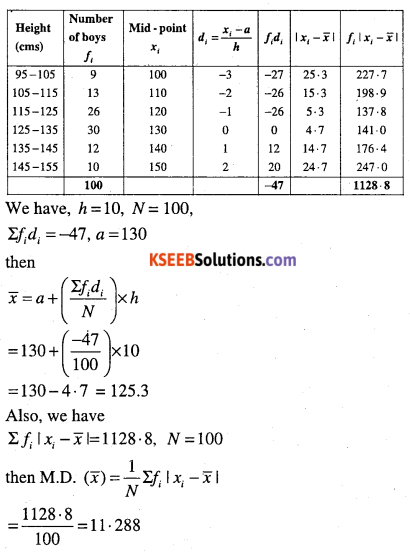
(iv)
| Marks obtained | Number of students |
| 10 – 20 | 2 |
| 20 – 30 | 3 |
| 30 – 40 | 8 |
| 40 – 50 | 14 |
| 50 – 60 | 8 |
| 60 – 70 | 3 |
| 70 – 80 | 2 |
Answer:
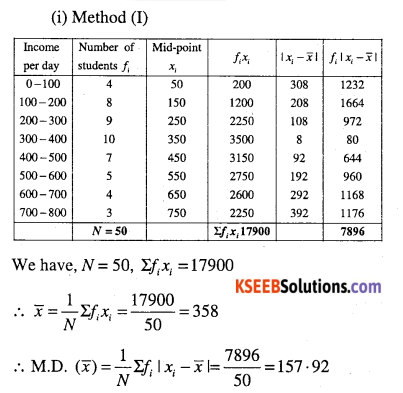
Method (II)
Method (I)
Method (ii)
Here a = 130, h = 10
(iii) Method (I)
Question 7.
Find the mean deviation about the median for the data:
(i)
| Class | Frequency |
| 0 – 10 | 6 |
| 10 – 20 | 7 |
| 20 – 30 | 15 |
| 30 – 40 | 16 |
| 40 – 50 | 4 |
| 50 – 60 | 2 |
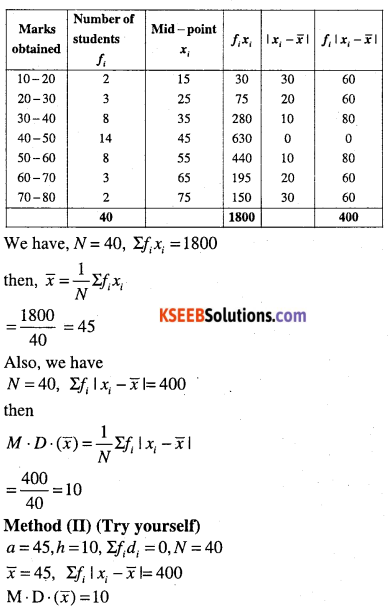
(ii)
| Marks | Number of Girls |
| 0 – 10 | 6 |
| 10 – 20 | 8 |
| 20 – 30 | 14 |
| 30 – 40 | 16 |
| 40 – 50 | 4 |
| 50 – 60 | 2 |
Answer:
(ii)
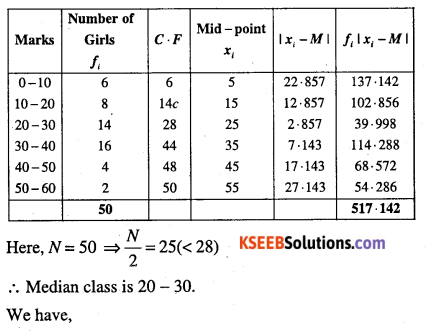
![]()
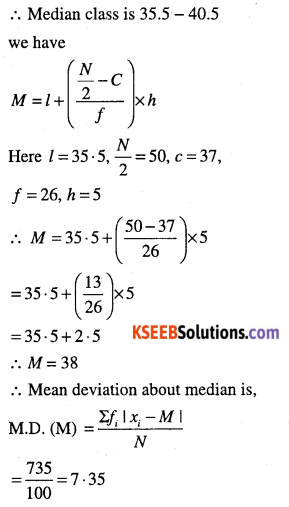
Question 8.
Calculate the mean deviation about median age for the age distribution of 100 persons given below.
| Age | Number |
| 16 – 20 | 5 |
| 21 – 25 | 6 |
| 26 – 30 | 12 |
| 31 – 35 | 14 |
| 36 – 40 | 26 |
| 41- 45 | 12 |
| 46 – 50 | 16 |
| 51 – 55 | 9 |
Answer:
First, modify the classes to make the data. continuous by subtracting 0.5 from the lower limit and adding 0.5 to the upper limit.
Question 9.
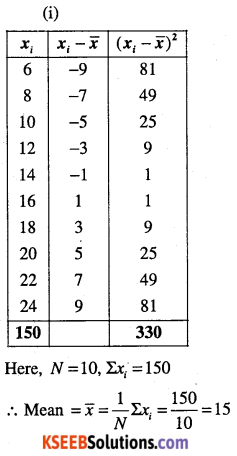
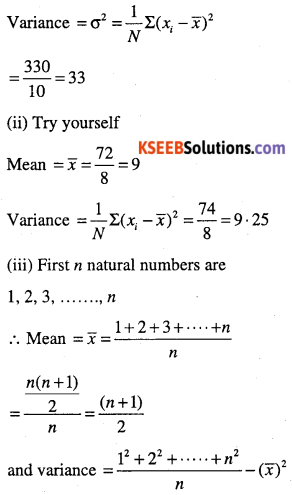
Find Mean and variance for each data:
(i) 6, 8, 10, 12, 14, 16, 18, 20, 22, 24.
(ii) 6, 7, 10, 12, 13, 4, 8, 12
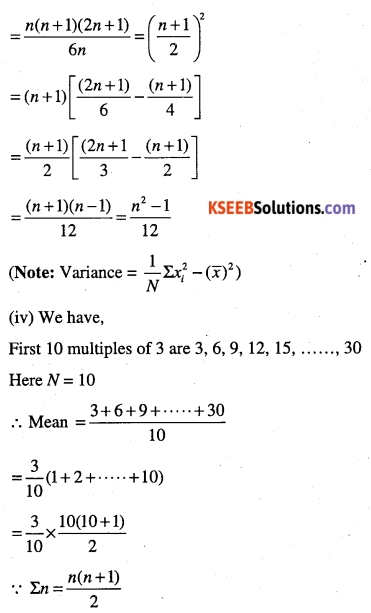
(iii) First n natural numbers.
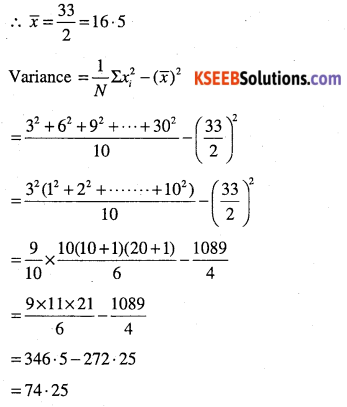
(iv) First 10 multiples of 3.
Answer:
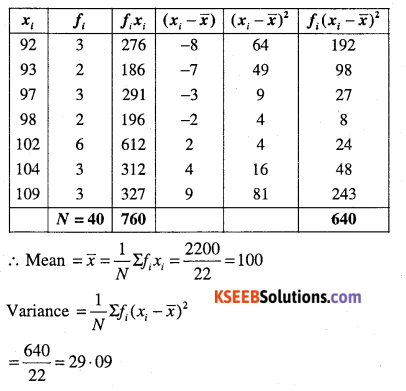
Question 10.
Find mean and variance.
(i)
| xi | 6 | 10 | 14 | 18 | 24 | 28 | 30 |
| fi | 2 | 4 | 7 | 12 | 8 | 4 | 3 |
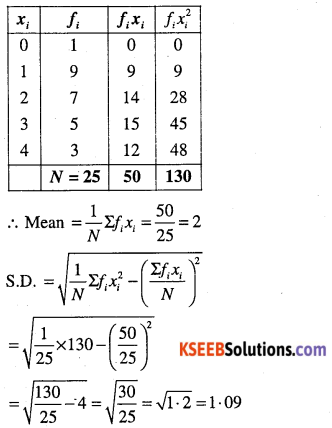
(ii)
| xi | 92 | 93 | 97 | 98 | 102 | 104 | 109 |
| fi | 3 | 2 | 3 | 2 | 6 | 3 | 3 |
Answer:
(i)
(ii)
![]()
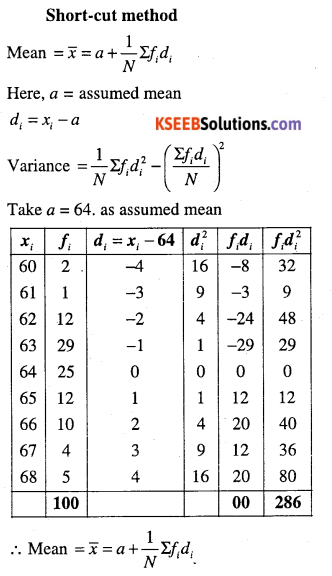
Question 11.
Find the mean and standard deviation using short-cut method.
| xi | 60 | 61 | 62 | 63 | 64 | 65 | 66 | 67 | 68 |
| fi | 2 | 1 | 12 | 29 | 25 | 12 | 10 | 4 | 5 |
Answer:
Question 12.
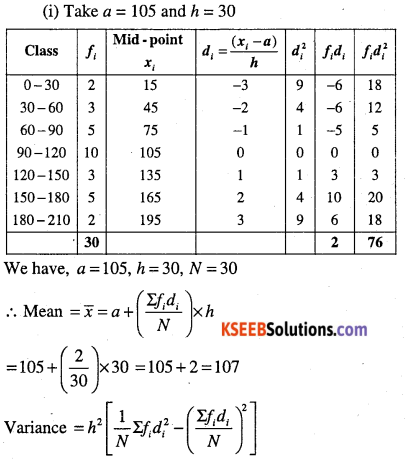
Find the mean and variance
(i)
| Class | Frequency |
| 0 – 30 | 2 |
| 30 – 60 | 3 |
| 60 – 90 | 5 |
| 90 – 120 | 10 |
| 120 – 150 | 3 |
| 150 – 180 | 5 |
| 180 – 210 | 2 |
(ii)
| Class | Frequency |
| 0 – 10 | 5 |
| 10 – 20 | 8 |
| 20 – 30 | 15 |
| 30 – 40 | 16 |
| 40 – 50 | 6 |
Answer:
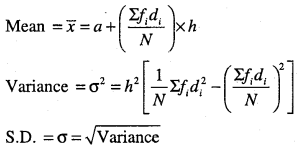
Question 13.
Find the mean, variance and standard deviation using short-cut method.
| Height (cms) | No of Children |
| 70 – 75 | 3 |
| 75 – 80 | 4 |
| 80 – 85 | 7 |
| 85 – 90 | 7 |
| 90 – 95 | 15 |
| 95 – 100 | 9 |
| 100 – 105 | 6 |
| 105 – 110 | 6 |
| 110 – 115 | 3 |
Answer:
Question 14.
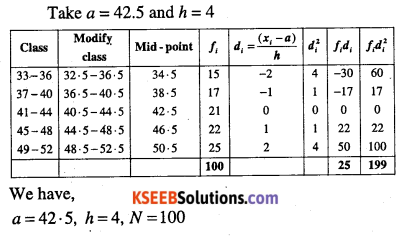
The diameters of circles (in mm ) drawn in a design are given below calculate S.D and mean diameter.
| Diameter | Circles |
| 70 – 75 | 15 |
| 75 – 80 | 17 |
| 80 – 85 | 21 |
| 85 – 90 | 22 |
| 90 – 95 | 25 |
Answer:
![]()
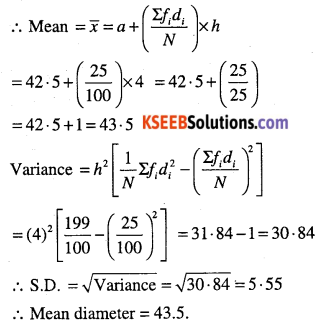
Question 15.
From the data given below state which group is more variable, A or B?
| Marks | Group A | Group B |
| 10 – 20 | 9 | 10 |
| 20 – 30 | 17 | 20 |
| 30 – 40 | 32 | 30 |
| 40 – 50 | 33 | 25 |
| 50 – 60 | 40 | 143 |
| 60 – 70 | 10 | 15 |
| 70 – 80 | 9 | 7 |
Answer:
We know that, the group having greater C.V.(co-efficient of variation) is said w be more variable than other. So, we compute mean and S.D. for groups A and B.
First we compute mean and S.D. for A.
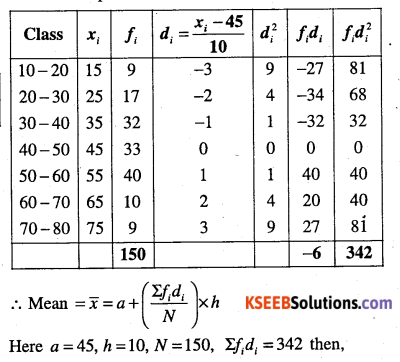
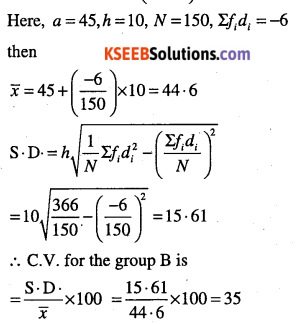
Clearly, B having greater C. V. than A. Therefore B is more variable.
Note:
For two frequency distributions with equal means, the series with greater S.D. is more variable than the other.
![]()
Question 16.
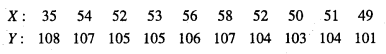
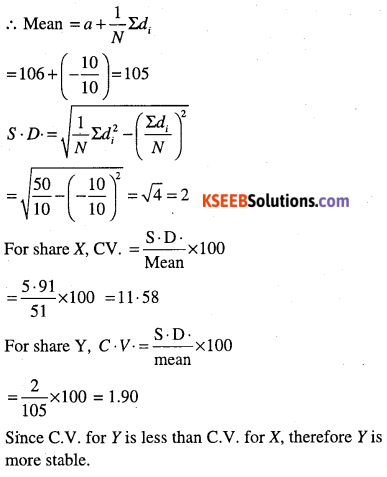
From the prices of shares X and Y below, find out which is more stable in value.
Answer:
Here, number of items for both = 10.
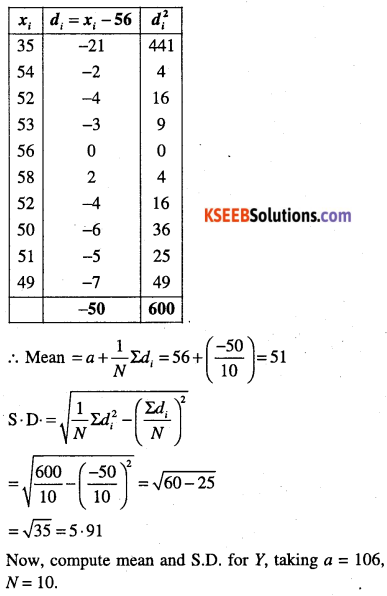
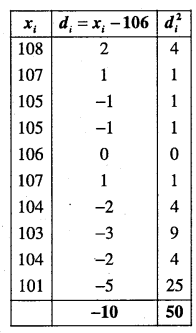
First we compute mean and S.D. for x, taking a = 56, N = 10.
Question 17.
An analysis of monthly wages paid to workers in two firms A and B, belonging to the same industry, gives the following results.
| A | B | |
| No. of wage earners | 586 | 648 |
| Mean of monthly wages (Rs ) | 5253 | 5253 |
| Variance of the distribution of wages | 100 | 121 |
(i) Which firm A or B pays larger amount as monthly wages?
(ii) Which firm A or B shows greater variability in individual wages?
Answer:
(i) Amount of monthly wages paid by firm A.
= 586 x mean wages
= 586 x 5253 = Rs.3078258
And amount of monthly wages paid by form B
= 648 x mean wages
= 648 x 5253 = Rs. 3403944.
Clearly, firm B pays more wages.
Alternatively,
The variance of wages in A is 100.
∴ S.D. of distribution of wage in A = 10
Also the variance of distribution of wages in firm B is 121.
∴ S.D. of distribution of wages in B = 11.
since the average monthly wages in both firms is same i.e., Rs. 5253, therefore the firm with greater S.D. will have more variability.
∴ Firm B pays more wages.
(ii) Firm B with greater S.D. shows greater variability in individual wages.
![]()
Question 18.
Two plants A and B of a factory show following results about the number of workers and the wages paid to them.
| A | B | |
| No – of workers | 5000 | 6000 |
| Average monthly wages | 2500 | 2500 |
| Variance distribution of wages | 81 | 100 |
In which plant A or B is there greater variability in individual wages?
Answer:
B. (Try yourself) (Ex. 13 Text book)
Question 19.
The following is the record of goals scored by team A in a football session:
For the team B, mean number of goals scored per match was 2 with a standard deviation 1.25 goals. Find which team may be considered more consistent?
Answer:
First, compute mean number of goals and S.D. for team A.
Given : Mean number of goals for the team B is 2 and S.D. is 1.25
Since S.D. For A is less than S.D for B.
∴ A is more consistent.
Question 20.
The sum and sum of squares corresponding to length x (in cm) and weight y (in gm) of 50 plant products are given below:
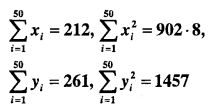
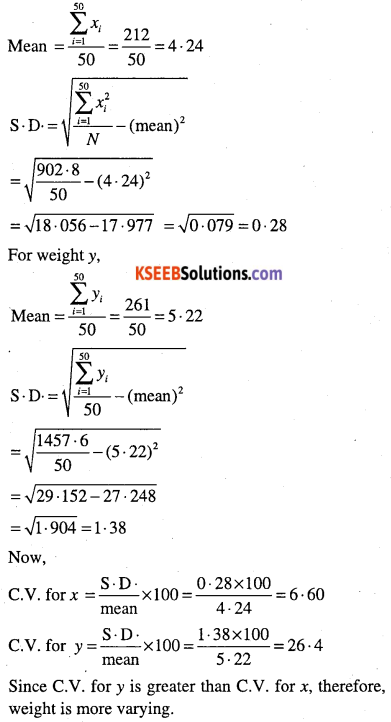
Which is more varying, the length or weight?
Answer:
![]()
Question 21.
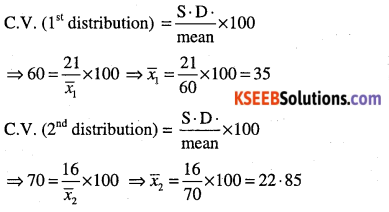
Co-efficient of variation of two distributions are 60 and 70, and the standard deviations are 21 and 16, respectively. What are their arithmetic means.
Answer:
Let \(\bar{x}_{1} \text { and } \bar{x}_{2} \) be arithmetic means of first and second distribution respectively. Then
Question 22.
The following values are calculated in respect of heights and weight of the students of a section of class XI.
| Height | Weight | |
| Mean | 162 – 6 cm | 52-36 kg |
| Variance | 127 – 69 cm2 | 23. 1361kg2 |
Can we say that the weight show greater variation than the height.
Answer:
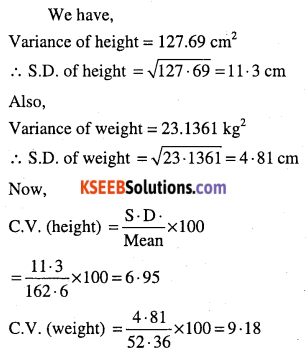
Clearly C.V. (weights) is greater than C.V. (heights). Weights show more variability than heights.
Miscellaneous Examples
Question 1.
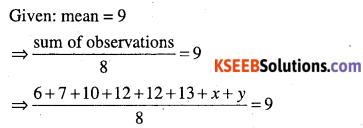
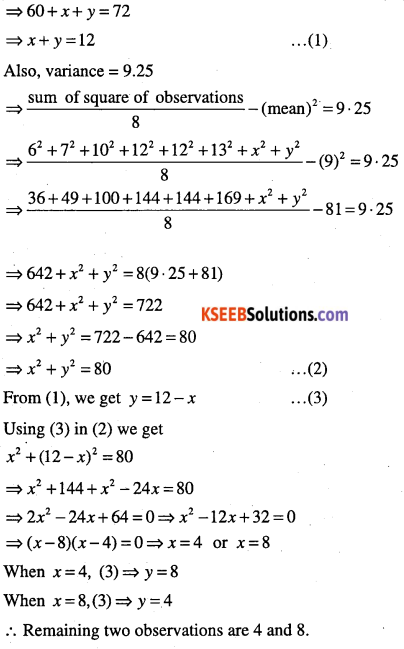
The mean and variance of eight observations are 9 and 9.25 respectively. If six of the observations are 6, 7, 10, 12, 12 and 13. Find the remaining two observations.
Answer:
Let the remaining two observation be x and y.
Question 2.
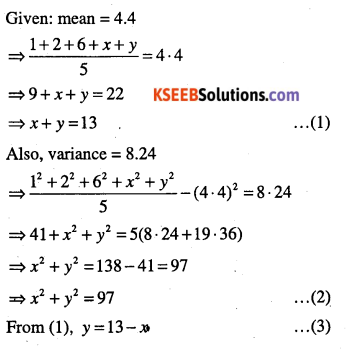
The mean of 5 observations is 4.4 and their variance is 8.24. If three observations are 1, 2 and 6, find the remaining two observations.
Answer:
Let the remaining two observations be x and
∴ Five observations are 1, 2, 6, x, y.
Question 3.
The mean and variance of 7 observations are 8 and 16 respectively. If five of the observations are 2, 4, 10, 12, 14. Find the remaining two observations.
Answer:
6 and 8 (Try yourself)
Here, x + y = 14, x2 + y2 = 100
Question 4.
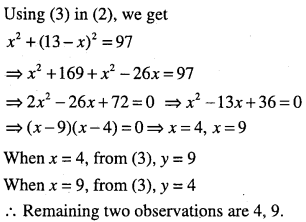
The mean and standard deviation of six observations are 8 and 4, respectively. If each observation is multiplied by 3, find the new mean and new standard deviation.
Answer:
Let six observations be
![]()
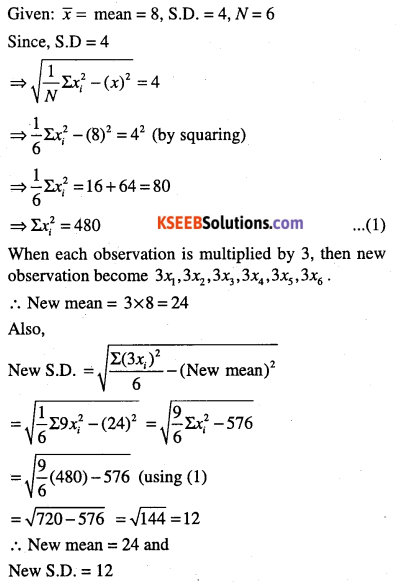
Question 5.
Given that \(\bar{x} \)is the mean and σ2 is the variance of n observations x1 , x2,……….. ,xn . Prove that the mean and variance of the observations ax1,ax2,………………,axn are \(a \bar{x} \) and a2a1 respectively (a ≠ 0)
Answer:
Question 6.
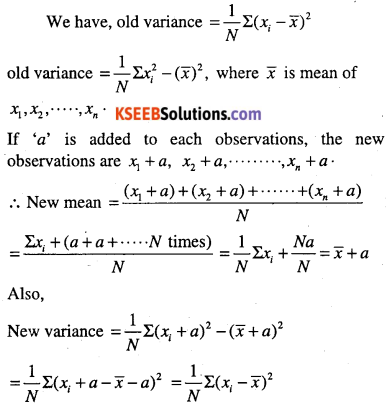
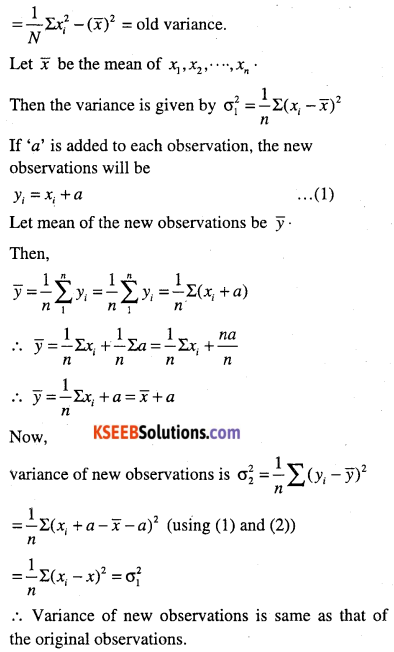
If each of the observation x1,x2,………. ,xn is increased by ‘a’, where a is positive or negative number, show that the variance remains unchanged.
Answer:
Question 7.
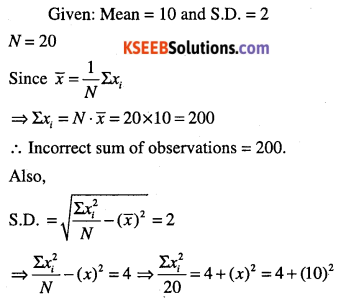
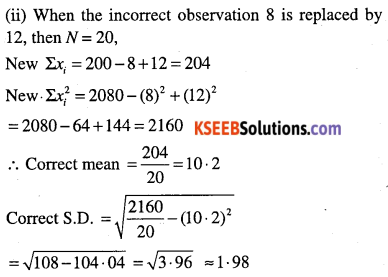
The mean and standard deviation 20 observations are found to be 10 and 2 respectively. On rechecking, it was fond that an observation 8 was incorrect. Calculate the correct mean and standard deviation in each of the following cases :
(i) If wrong item is omitted,
(ii) If it is replaced by 12.
Answer:
Question 8.
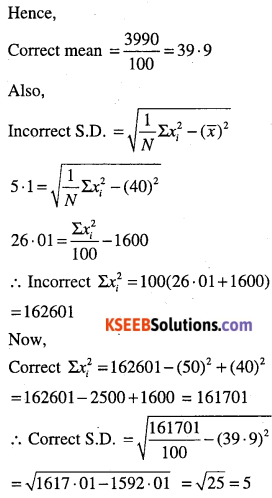
The mean and standard deviation of 100 observations were calculated as 40 and 5.1 respectively by a student who took by mistake 50 instead of 40 for one observation. What are the correct mean and standard deviation?
Answer:
Given: N = 100
Incorrect mean = 40 = \(a \bar{x} \)
Incorrect S.D. = 5.1
We have, \(\bar{x}=\frac{1}{N} \Sigma x_{i}\)
⇒\(\Sigma x_{i}=N \bar{x}=100 \times 40=4000\)
∴ Incorrect sum of observations = 4000.
∴ Correct sum of observations = 4000 – 50 + 40 = 3990.
![]()
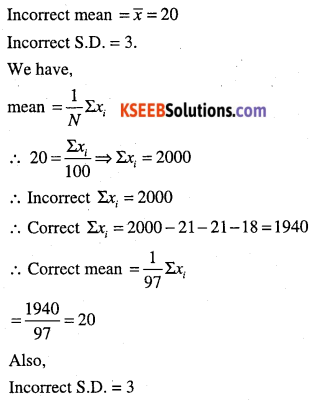
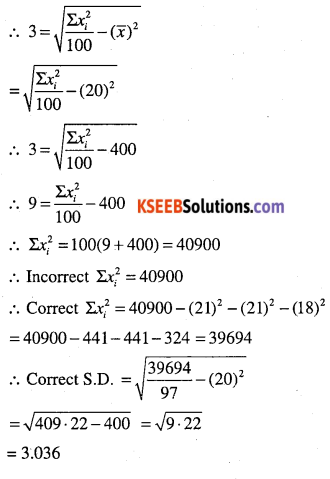
Question 9.
The mean and standard deviation of a group of 100 observations were found to be 20 and 3 respectively. Later on it was found that three observations were incorrect, which were recorded as 21, 21 and 18. Find and standard deviation if the incorrect observations are omitted.
Answer:
Given N = 100,New N = 97
Question 10.
The mean and standard deviation of marks obtained by 50 students of a class in three subjects, Mathematics, Physics and Chemistry are given below.
| Subject | Mathematics | Physics | Chemistry |
| Mean | 42 | 32 | 40 – 9 |
| S D | 12 | 15 | 20 |
Which of three subjects shows the highest variability in marks and which shows the lowest?
Answer:
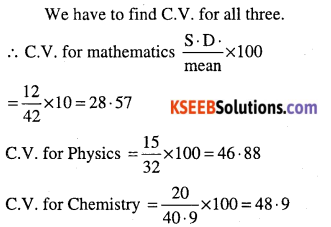
Chemistry shows high variability and Mathematics shows lowest variability.