Students can Download 2nd PUC Statistics Previous Year Question Paper June 2015, Karnataka 2nd PUC Statistics Model Question Papers with Answers helps you to revise the complete Karnataka State Board Syllabus and score more marks in your examinations.
Karnataka 2nd PUC Statistics Previous Year Question Paper June 2015
Time: 3 Hrs 15 Min
Max. Marks: 100
Section -A
I. Answer any TEN of the following questions: (10 x 1 = 10)
Question 1.
Define cohort.
Answer:
Cohort is a group of individuals who are born at the same time and who experience the same mortality conditions.
Question 2.
What is the value of index number for the base year?
Answer:
100
Question 3.
Which index number shows upward bias?
Answer:
Laspeyre’s index number.
Question 4.
Give an example for random variation.
Answer:
Shut down of production of a factory due to fire accident.
Question 5.
Write down the relationship between mean and variance of a Bernoulli distribution.
Answer:
Mean > Variance i.e. p > pq.
Question 6.
For a chi-square variate with 10 d.f., find the variance.
Answer:
If n = 10, then variance = 2n = 2 × 10 = 20
![]()
Question 7.
What is parameter space?
Answer:
The set of all admissible values of the parameter is called parameter space.
Question 8.
Given σ2 = 16 cm2 and n = 49, calculate standard error of sample mean.
Answer:
σ2 = 16;
∴ σ = \(\sqrt{16}\) = 4, n = 49
S.E (x̄) = \(\frac{\sigma}{\sqrt{n}}=\frac{4}{\sqrt{49}}=\frac{4}{7}\) = 0.5714
Question 9.
What is type I error?
Answer:
Type I error is taking a wrong decision to reject the null hypothesis, when it is actually true.
Question 10.
Statistical quality control helps in detecting which type of variation?
Answer:
Assignable cause of variation.
Question 11.
What do you mean by a non degenerate solution in a transportation problem?
Answer:
If the number of non-zero allocation are equal to (m + n – 1) then, the solution is called non-degenerate.
Question 12.
Write down one advantage of inventory?
Answer:
Inventory facilitates bulk purchase of raw materials at discount rates.
Section-B
II. Answer any TEN of the following questions: (10 x 2 = 20)
Question 13.
In a locality out of 20,000 births 100 mothers died due to child birth complications. Calculate maternal mortality rate.
Answer:
Maternal mortality rate:

Question 14.
If Σ p0q = 1200 and Σp1q = 1500, compute suitable index number.
Answer:

Question 15.
Mention the steps involved in the construction of consumer price index number.
Answer:
- Object and the scope
- Conducting family budget survey.
- Obtaining the price quatation.
- Methods of constraction:

Question 16.
Write down the normal equations for fitting linear trend.
Answer:
Linear equation is: y = a + bx
Normal equations are : na + bΣx = Σ y
aΣx + bΣx2 = Σ xy.
Question 17.
Write down the conditions for the application of binomial expansion method of interpolation and extrapolation.
Answer:
The conditions are:
- The values of the independent variable (x) should have a common difference, i.e., in A.P.
- The value of ‘X’, for which the value of’Y’ is tobe interpolated must be one of the value of x.
Question 18.
Write down the Bernoull distribution with parameter p = 0.25.
Answer:
The Bernoulli distribution is:-with p = 0.25
P(x) = (0.25)x (1-0.25)1-x ; x = 0, 1
= (0.25)x (0.75)1-x x = 0,1
OR

![]()
Question 19.
Mention two features of a student’s t-distribution.
Answer:
- The parameter is ‘n’ called d.f.
- Mean = E(x) = 0 and
Var(x) = \(\frac{n}{n-2}\) for n > 2
Question 20.
What are point estimation and interval estimation?
Answer:
Estimation of unknown parameter by proposing a specific value as an estimate is called point estimation.
While estimating the unknown parameter by proposing an interval, which is likely to contain the parameter is called interval estimation.
Question 21.
Write down two utilities of standard error.
Answer:
- It is used in interval estimation, to write down the confidence intervals.
- It is used in testing of hypothesis totest whether the difference between the sample statistic and the population parameter is significant or not.
Question 22.
What do you mean by process control and product control in statistical quality control?
Answer:
Controlling the quality of the product during the manufacturing process itself is the Process control. Controlling the quality of the finished products/ manufactured products is called product control.
Question 23.
Mention two method of obtaining initial basic feasible solution for a transportation problem.
Answer:
- Matrix-Minim method and
- North-west corner rule.
Question 24.
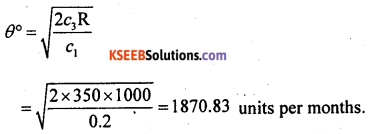
Given R = 1000 units/month, C3 = Rs. 350 and C1 = Rs. 0.20/unit/months, find Q°.
Answer:
Section – C
III. Answer any EIGHT of the following questions : (5 x 8 = 40)
Question 25.
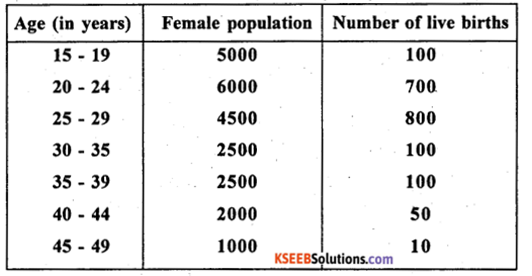
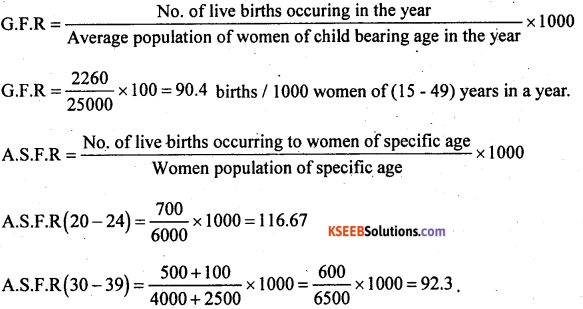
From the following data calculate GFR, ASFR(20 -24) and ASFR(30 – 39)
Answer:
Question 26.
Define index number. Mention three limitations of index numbers.
Answer:
Index number is a statistical measure designed to show an average change in a variable or group of related variables over a period.
The limitations are:
- Many formulae are used and they give different answers for the index.
- As the customs and habits change from time to time, the use of commodities also vary.
- There is an ample scope for bias in the construction of index number.
![]()
Question 27.
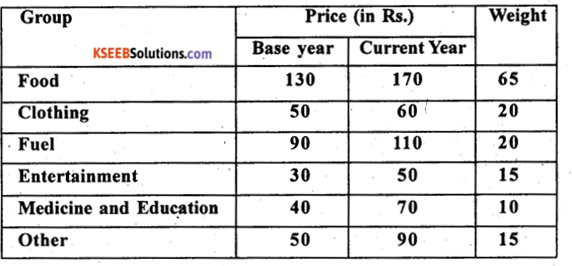
Compute cost of living index number.
Answer:
Weights are given, use family budget method: I01 = \(\frac{\sum p w}{\sum w}\) P = \(\frac{p_{1}}{p_{0}} \times 100\) ; w-weights
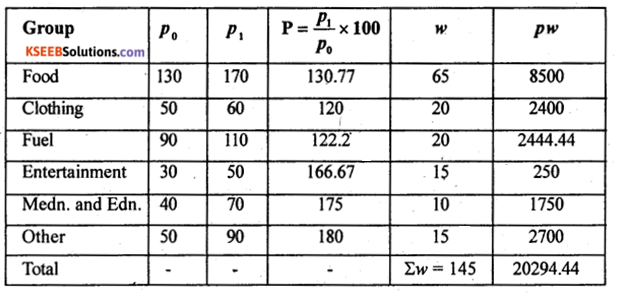
Consumer / cost of living index number:

There is net increase of cost of living by 39.96% in the current year as compared to base year.
Question 28.
Compute the trend values by finding five yearly moving averages for the following data.

Answer:
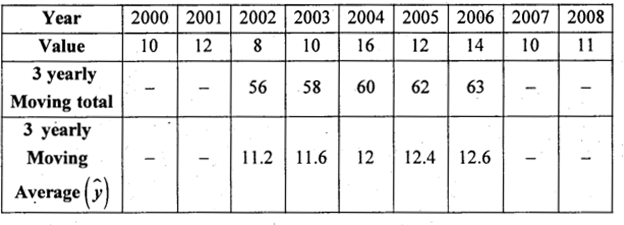
ŷ – trend values.
Overall trend in the values of times series shows upward trend.
Question 29.
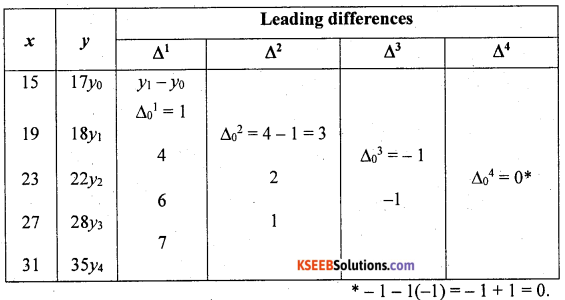
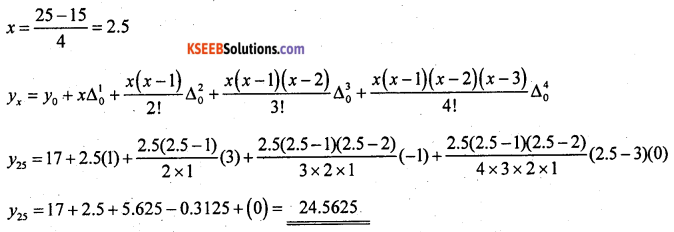
Using Newton’s forward difference method to find the value of ‘y’ when x – 25.

Answer:
The number of known values ofy, n = 5, so prepare leading difference table up to A4.

Question 30.
The probability that a bomb hits the target is \(\frac { 1 }{ 4 }\) Five bombs are aimed at the target. Find the probability that:
(i) 3 bombs hit the target
(ii) at the most two bombs hit the target.
Answer:
Let x denote the number of bombs hit the target is a Binomial variate with the parameters
n = 5, P = \(\frac { 1 }{ 4 }\) = 0.25 and q= 1 – p= 1 – 0.25 = 0:75.
The p.m.f is:-
p(x) = ncx px qn-x: x = 0,1,2 n
p(x)= 5cx (0.25)x (0.75)5-x x = 0,1,2……..5
(i) p(3 bombs hit the target) =p(x = 3) = 5c3 (0.25)3 (0.75)5-3 = 10 × 0.015625 × 0.5625
= 0.08789.
(ii) p(at most two bombs hit the target) = p(x ≤ 2)
= p(x = 0) + p[x = l) + p(x = 2)
= 5c0 (0.25)° x (0.75)5-0 + 5c1 (0.25)1 (0.75)5-1 + 5c2 (0.25)2 (0.75)5-2
= 1 × 1 × 0.2373 + 5 × 0.25 × 0.3164 + 10 × 0.0625 × 0.4218
= 0.2373 + 0.3955 + 0.2637 = 0.8965.
Question 31.
In a Hyper-geometric distribution if a = 4, b = 6 and n = 4, find mean and variance.
Answer:
For Hyper-geometric distribution: a = 4, b = 6, n = 4

![]()
Question 32.
From the following data test whether mean daily wages of workers of Factory-A and Factory-B are equal. (Use 1% I.o.s.)

Answer: Given:
n1=200, n2 = 450, x̄1=195, x̄2 – 200, S1 = 20, S2 = 30, α = 1%
H0 : Mean daily wages of workers of factory A and B are equal (H0: μ1 = μ2)
H1 : Mean daily Wages of workers of factory A and B are not equal (H1 : μ1 ≠ μ2)

Under H0, the test statistic is:-

Zcal = – 2.449.
At α = 1% the two tail critical values are ±K = ±2.58 Here Zcal lies in A.R (accepetance region), there fore H0 is accepted.
Conclusion: Mean daily wages of workers of factory A and B workers are equal (i.e., µ1 = µ2)
Question 33.
From the following data, test whether literacy and smoking are independent at 5% level of significances.

Answer:
Chi-Square test for Independence of attribute
H0: Literacy and smoking are independent.
H1 : Literacy and smoking are dependent
The given data can be written in a 2 × 2 contingency table as below:

under H0 the χ2 – test statistic is:-
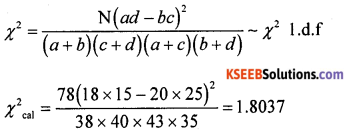
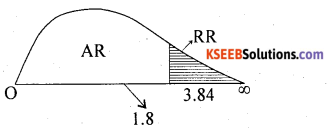
At α = 5% for 1 .d.f the upper tail critical value K2 = 3.83. Here χ2cal lies in A.R.
∴ H0 is accepted
conclusion: Literacy and smoking are independent.
Question 34.
The following data relates to the number of knitting defects per unit length of cloth manufactured by a textile mill.

Draw control chart with λ1 – 3.
OR
(For Visually Challenged Students Only)
Briefly explain single sample plan.
Answer:
Standand is known: given λ1 = 3
Control limits for number of defects is C-chart
Central line: C.L = λ1 = 3
Lower control limit: L.C.L = \(\lambda^{\prime}-3 \sqrt{\lambda^{\prime}}=3-3 \sqrt{3}\)= -2.196 = 0
Upper control limit: U.C.L =\(\lambda^{\prime}+3 \sqrt{\lambda^{\prime}}=3+3 \sqrt{3}\)= 8.2
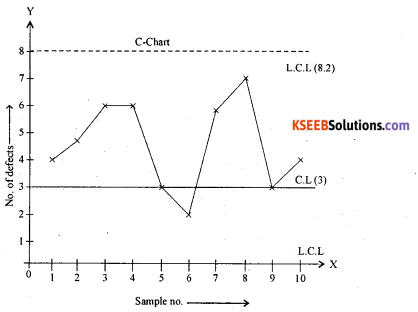
Conclusion: All the sample points lies with in the control limits, so the production process is under control.
OR
For visually challanged students only
![]()
Question 35.
A tailor gets a profit of Rs. 100 from a shirt and Rs. 170 from a pant. In a week of 56 hours, he uses 20 hours for stitching and 36 hours for cutting. He requires one hour to stitch a shirt and two hours to stitch a pant. For cutting he requires two hours for a shirt and three hours for a pant. Formulate L.P.P.
Answer:
Let x and y the number of shirts and points
The objective function / L.P.P. is:-
Maximize z= 100 x + 170 y
Subject to constraints:
Stiching: x + 2y ≤ 20
Cutting: 2x + 3y ≤ 36 and x,y ≥ 0
Question 36.
The cost of a scooter is Rs. 36,000. Its resale value and maintenance cost at different years is given below:

Determine the optimal year for replacement of the scooter.
Answer:
P = 36,000 let sn be the resale value and Ci be the maintenance cost. The Annual average cost:
A(n) = \(\frac { T }{ n }\) . Here T-total maintenance cost = (P-Sn) + ΣCi; n-the year of service.
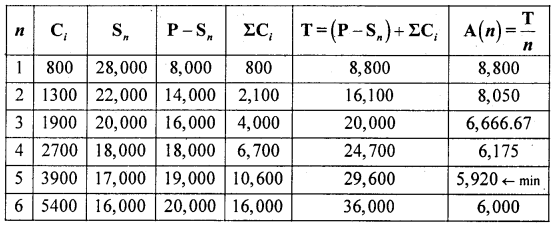
From the above table A(n) is least for the year n = 5 so, the scooter is replaced after use of 5 years, (is the optimal year for replacement of the scooter)
Section – D
IV. Answer any TWO of the following questions : 2 x 10 = 20
Question 37.
For the following data compute standardized death rates and comment.

Answer:


For locality A:
ASDR(0- 20) = \(\frac { 72 }{ 4000 }\) × 1000 = 18;
For locality B:
A. S.D.R(B) = \(\frac { 128 }{ 8000 }\) × 1000 = 16 similarly for other age groups can be calculated
Standardised death rates for the two localities are:

Comment: Here SDR(B) < SDR(A) and so, locality B is heather than locality A.
![]()
Question 38.
Compute Fisher’s price index number. Show that it satisfies time reversal test and factor reversal tests.

Answer:
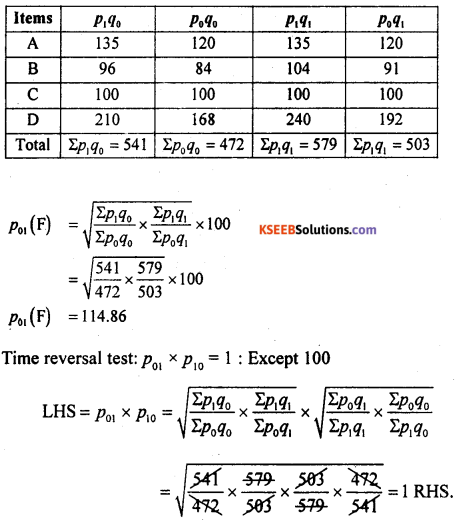
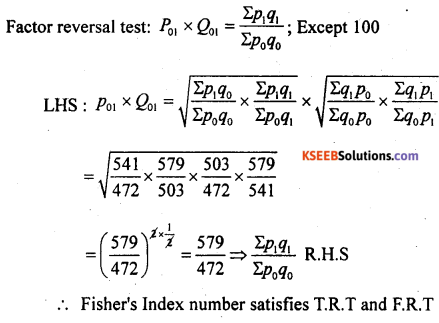
Question 39.
Fit an exponential trend line of the form y = ab*. Also estimate the value for 2008.

Answer:
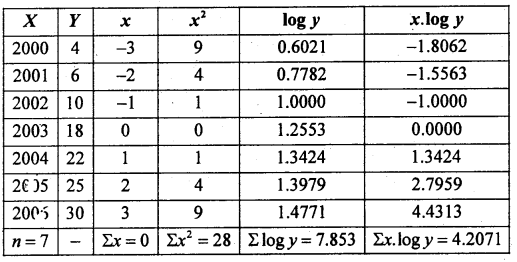
Here \(x=\frac{x-\bar{x}}{c}\); x̄ = 2003; c = 1
The normal equations: n log a + log b. Σx = Σlogy
since Σx = 0; loga = \(\frac{\Sigma \log y}{n}=\frac{7.853}{7}\) = 1.1218
∴ a = AL(loga) = AL(1.1218)
a = 13.2373
log a. Σx + log b Σx2 = Σx. logy
log b = \(\frac{\Sigma x \log y}{\Sigma x^{2}}\) ; logb= \(\frac{4.2071}{28}\) =0.1502
∴ b = AL (log b) = AL (0.1502) = 1.4132 ; The fitted exponential trend line is: y = abx ;
ŷ = 13.2373(1.4132)x.
Estimation for the year 2008; x = 5; ŷ = (2008) = 13.2373(1.4132)5 = 74.6135.
Question 40.
Consider the following data:

Fit a Poisson distribution to the data and test the goodness of fit. (Use 5% L.O.S.)
Answer:
The parameter of Poisson variate λ is:
From the distribution: Mean = x̄ = λ = \(\frac{\Sigma f x}{N}\)

λ = 0.99
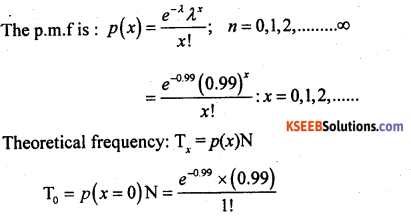
T0 = 0.3716 × 100 = 37.16 = 37
![]()
T1 = \(\frac{0.99}{1}\)T0 =0.99 × 37.16 = 36.7884 = 37
T2 = \(\frac{0.99}{2}\) T1 = 0.495 × 36.7884 = 18.2103 = 18
T3 = \(\frac{0.99}{3}\)T2 = 0.33 × 18.2103 = 6.0094 = 6
T = \(\frac{0.99}{4}\)T3 = 0.2475 × 6.0094 = 1.4873 = 2
T 5, = \(\frac{0.99}{5}\)T4 0.198 × 1.4873 = 0.2945=0
T 6 = \(\frac{0.99}{6}\) T5 = 0.165 × 0.2945 = 0.0486= 0
T7 or more =N – T6= 100 – 100 = 0.
The fitted observed and theoretial frequency distribution is:

H0: Poisson distribution is good fit {i.e., Oi = Ei}
H1: Poisson distribution is not good fit {i.e., 0i ≠ Ei}
CHI – SQUARE TEST: Let 0≠ and E. be the observed (f) frequency and theoretical frequency (Tx)
Then the χ2-test statistic is:

λ is estimated from the data so (n – 2) d.f.
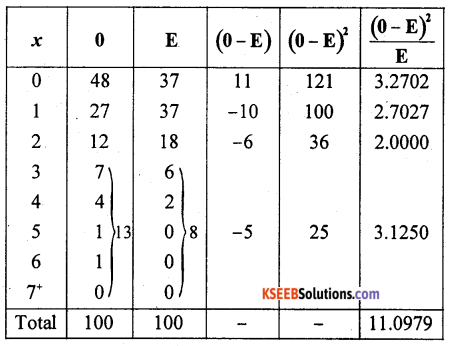
∴ χ2cal= 11.0979; n = 4
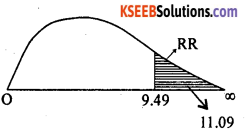
At α = 5% for (n – 2) = 4 – 2 = 2 d.f the upper tail critical value K2 = 9.49. Here χ2cal lies in
R.R. ∴ H0 is rejected and H1 is accepted.
OR
Conclusion: 0i ≠ Ei; i.e., P.D. is not a good fit.
![]()
Section-E
V. Answer any TWO of the following questions : 2 x 5 = 10
Question 41.
The weekly wages of workers are normally distributed with mean Rs. 3,000 and S.D. Rs. 500. Find the probability of workers whose weekly wages will be.
(i) More than Rs. 3,400
(ii) Between Rs. 2,500 and Rs. 3,500.
Answer:
Let A: be the weekly wages is a normal variate with the parameters mean : μ = 3,000 and
S. D: σ = 500.
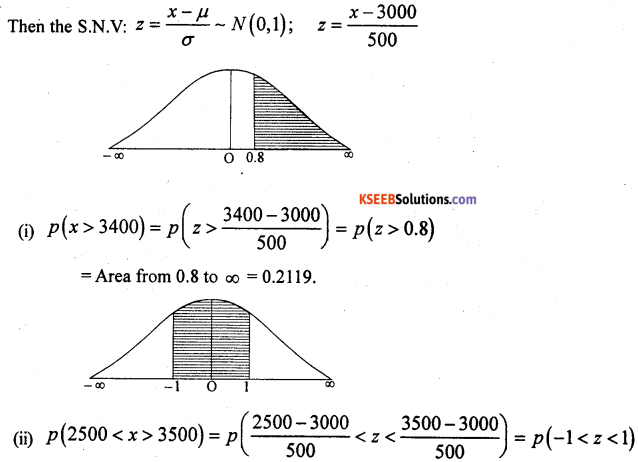
= Area from (-1) to 1
= Area from (-1) to ∞ – Area from 1 to ∞
= 0.8413 – 0.1587 = 0.6826.
Question 42.
In a random sample of 1000 persons from a large population, 470 are females. Can it be concluded that males and females are in equal proportion in the population? (use a = 0.05).
Answer:
Given: n = 1000; x = 470; .v P = \(\frac { x }{ n }\) = \(\frac { 470 }{ 100 }\) 0.47 and P0/P – population proportion = 0.5;
Q0 = 1 – p0 = 0.5 [male and female are in equal in proportion]
H0: Male and female are in equal proportion [P0 = 0.5]
H1: Male and female are not in equal proportion [p0 ≠ 0.5]
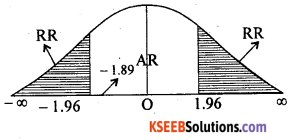
under H0, the test statistic is:-

At α = 0.5 the two tail critical values are ±1.96 Here zcal lies in A.R. ∴ H0 is accepted.
Conclusion: P0 = 0.5 [male and female are in equal proportion]
Question 43.
It is required to test whether those who practice yoga have average blood sugar less than 120. A sample consisting of 17 persons who practice yoga is observed. If their mean blood sugar is 108 and S.D. is 8, what would you conclude? (Use 5% level of significance).
Answer:
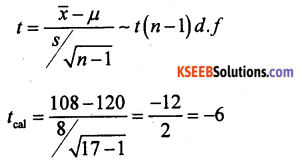
Given: µ = 120; n = 17, x̄ = 108; s = 8 α = 5% (n < 30 small samplet-test).
H0 : The average blood sugar is 120 (µ = 120)
H1 : Average blood sugar is less than 120 (µ < 120)
Under H0, the t-test statistic is:-
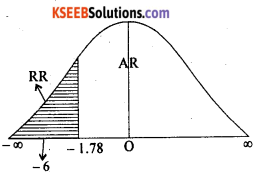
At α = 5% for (n – 1) = 17 – 1 = 16 d.f. the lower tail critical value – K = – 1.75. Here tcal lies in R.R.
∴ H0 is rejected and H1 is accepted.
Conclusion: Average blood sugar is less than 120.
![]()
Question 44.
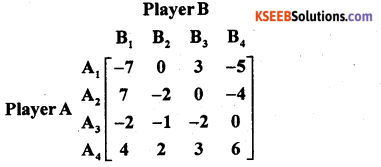
Find the solution of the game by the principle of dominance for the following pay-off matrix of A.
Answer:
Answer:

By principle of dominance, all the payoffs of A4 are more or equal to all the payoffs of A1 and A3. SO, A4 dominates A1 and A3, delete A1, A3.

All the payoffs of B2 are less than all the payoffs of B1 and B3. So B2 dominates B1 and B3, delete B1, B3.

A4 dominates A2, delete A2

B2 dominates B4, delete B4.

Saddle point occurs at (4,2) / A4, B2.
Suggested optimal strategies are A4, B2 value of the game ν = 2 is the solution the game.