Students can Download 2nd PUC Statistics Previous Year Question Paper March 2017, Karnataka 2nd PUC Statistics Model Question Papers with Answers helps you to revise the complete Karnataka State Board Syllabus and score more marks in your examinations.
Karnataka 2nd PUC Statistics Previous Year Question Paper March 2017
Time: 3 Hrs 15 Min
Max. Marks: 100
Instructions:
- Statistical table and graph sheets will be supplied on request.
- Scientific calculators may be used.
- All working steps should be clearly shown.
Section – A
I. Answer any ten of the following questions: ( 10 × 1 = 10 )
Question 1.
Define fertility.
Answer:
Fertility refers to the births occurring to women of child bearing age.
Question 2.
Does Marshall-Edgeworth’s Index number satisfy factor reversal test?
Answer:
No
Question 3.
Which price of the commodities is used in the construction of cost of living index number?
Answer:
Retail/consumer prices.
Question 4.
Give an example for seasonal variation.
Answer:
Incease in employement during harvest season in agriculture sector.
![]()
Question 5.
In which distribution mean and variance are equal?
Answer:
Poisson distribution.
Question 6.
Write the mean of /-distribution.
Answer:
Mean = 0.
Question 7.
What is point estimation?
Answer:
‘While estimating the unknown parameter, if a specific’value is proposed as an estimate, which is called Point estimation’.
‘While estimating the unknown parameter instead of a specific value, an interval is proposed, which is likely to contain the parameter is called Interval estimation’
Question 8.
What is power of a test?
Answer:
It is the probability of rejecting the null hypothesis when it is not true. (1 – β ),
Here β = P (Type II Error) which is referred as ‘consumers risk
Question 9.
When is the pooling of the frequencies done in testing of goodness of fit?
Answer:
When expected frequencies are less than 5.
Question 10.
What is defect?
Answer:
- A defect is a quality characteristic, which does not conform to specifications.
- The presence of one or more defects in a product/article is a defective.
![]()
Question 11.
Mention a need of replacement of an item.
Answer:
- As the equipment grow older, its maintenance cost would be costlier.
- Production cost would be lesser in new equipments.
Question 12.
What is meant by inventory?
Answer:
An Inventory is a physical stock of goods, which is held for the purpose of future production or sales.
Section – B
II. Answer any ten of the following questions: ( 10 × 2 = 20 )
Question 13.
Mention two uses of life table.
Answer:
They are used in computation of actuarial of premium, bonus etc, of policies by Insurance Agencies. OR
- Life Tables are used in research activities in Biology, Medicine, Pharmacology, Demography, Psychology, Sociology etc.
- They are used to study population growth and forecast the size and sex distribution of the
Population. OR - Life Tables give Mortality and Survival ratios at different ages.
- Life tables give the life expectancy at different age. OR
- These are useful in public administration, heath care, planning and population control
Question 14.
Why is Fisher’s index number called as an ‘Indeal Index Number’?
Answer:
Fisher’s Index Number is called as ideal because, it is free from bias in use of weights ie. it takes both current and base year quantities as weights.
- It is based on geometric mean which is considered as best average
- It satisfies both time reversal tests and factor reversal tests
Question 15.
If Iptq = 600 and Epgq = 500 then, find suitable price index number.
Answer:
Kelly’s P.I.No.

Question 16.
What are the different phases in a business cycle?
Answer:
(1) Prosperity (2) Decline (3) Depression and (4) Improvement.
![]()
Question 17.
Write down the assumptions of interpolation and extrapolation.
Answer:
- The assumptions made in interpolation and extrapolations are:
- There are no sudden jumps in the values of dependent variable(Y) from one period to another(X).
- The rate of change of figures (Y) from one period to another(X) is uniform.
- There will be no consecutive missing values in the series.
Question 18.
Write down the p.m.f. of Bernoulli distribution with parameter p = 0.4.
Answer:
p(x) = px q1 – x; x = 0,1, : p(x) = 0.4x 0.61 – x; x = 0,1
Here = 1 – p = 1 – 0.4 = 0.6
Question 19.
If Z1 and Z2 are two independent SNV’s, then name the distribution of Z12 + Z22 and find its mean.
Answer:
It is a chi-square distribution with 2 d.f. Mean = n = 2.
Question 20.
Define type – I and type – II errors.
Answer:
Type I Error is taking a wrong decision to reject the null hypothesis when it is actually true.
Type II Error is taking a wrong decision to accept the null hypothesis when it is actually not true.3
Question 21.
If n = 10, s2 = 20 and σ2 = 25, find chi-square test statistic.
Answer:

Question 22.
What do you mean by process control and product-control?
Answer:
- Controlling the quality of the product during the manufacturing process itself is called process control.
- Controlling the quality of the finished products/manufactured products is called product control.
Question 23.
If the depreciation and the cumulative maintenance costs of an equipment for the third year are Rs. 10,000 and Rs. 10,400 respectively, find the annual average cost.
Answer:

Question 24.
Given R = 3600 units/year, C3 = Rs. 50 and C1 = Rs. 4/unit/year, find Q0.
Answer:

Section – C
III. Answer any eight of the following questions: ( 8 × 5 = 40 )
Question 25.
Find standardized death rate for the follwoing data:

Answer:
Let A be ASDRS and Ps be the standard population.
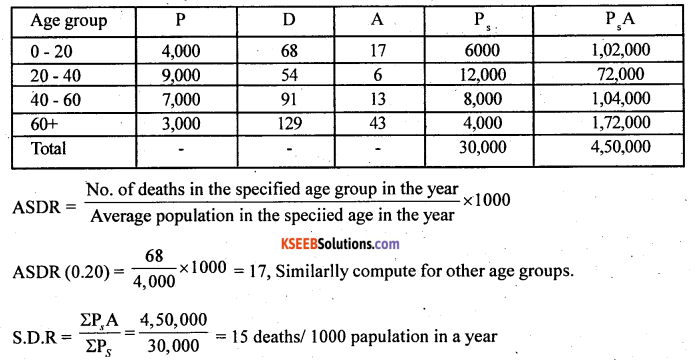
Question 26.
Mention any five steps involved in the construction of Index number.
Answer:
Any two of the following :
- Purpose and the scope
- Selection of base period or
- Selection of commodities or items
- Obtaining price quotations
- Choice of an average
- 6. Selection of weights
- Selection of suitable formula
![]()
Question 27.
Find cost of living index number for the following data.

Answer:
Weights – W are given, use family budget method.

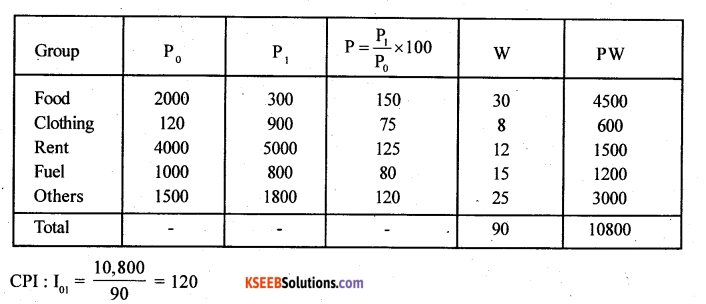
Question 28.
Find five yearly moving average for the following data.

Answer:
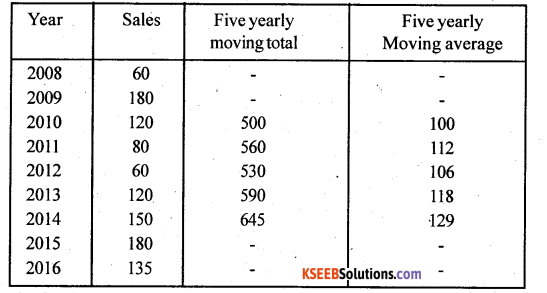
Question 29.
Following is the data regarding annual nt life insurance premium. Using binomial expansion method estimate the premium at the age 30 and 45.

Answer:
Let X and Y be the age and premium. The number of known values of y : n = 4, the Binomial exponsion (y – 1)4 = 0. .

y4 – 4y3 + 6y2 – 4y1+ y0 = 0 ……………(1)
By increasing sufficiences of y by T we get
y5 – 4y4 + 6y3 – 4y2 + y1 = 0 …………. (2)
From (1) 2256 – 4(1996) + 6y2 – 4(1581) +1426 = 0.
2256 – 7984 + 6y2 – 6324 + 1426 = 0 ,
6y2 – 10626 = 0
∴ y2 = Rs.1771
From (2) y5 – 4(2256) + 6(1996) -4(1771)+ 1581 =0
y5-9024 + 11976 – 7084 + 1581 =0
∴ y5 = Rs. 2551
Question 30.
On an average a typist makes 2 mistakes per page. Find the probability that a page types by him has (i) 2 mistakes (ii) at most 1 mistake.
Answer:
Let X be the number of typing mistakes is a poisson variable with the parameter λ = 2.

(i) P(2 mistakes) =p(x = 2) = \(\frac{e^{-2} 2^{x}}{2 !}=\frac{0.1353 \times 4}{2}\) = 0.2706
(ii) P(at most 1 mistake) =p(x ≤ 1) – p(x = 0) + p(x = 1)

![]()
Question 31.
A box contains 8 red and 4 white balls. From this box 5 balls are drawn at random What is the probability that the sampel contains 3 red balls?
Answer:
Let X be the number of red balls is a Hypergeometric variate then : a(x) = 8, b = 4 and n = 5.

Question 32.
Following is the data regarding mean weights of randomly selected boys and girls of PUC students. Test whether, mean weight of boys is less than mean weight of girs. [Use 5% I.o.S]

Answer:
Given: n1 = 64, n2 = 48, x̄1 = 50, x̄2 = 54, S1 = 8, s2 = 12.
H0 : Mean weight of Boys and Girls is same (µ1 = µ2)
H1 : Mean weight of Boys is less than Girls (µ1 < µ2) {Lower fail test -k}
Under H0 the test statistic is:
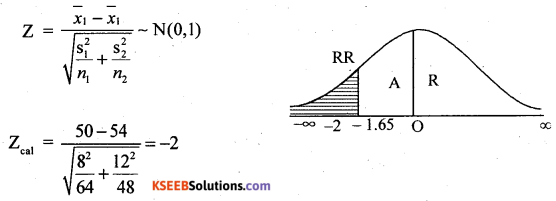
At a = 5% the lower critical value -k = – 1.65
Here Zcal lies in rejection region (RR).
∴ H0 is rejected and H1 accepted.
Conclusion: Mean weight boys is less than girsl.
Question 33.
A specified brand of automobile tyre is known to have average life of 40000 km. A random sample of 10 types of this brand, when tested resulted in the average life 39000 km and S.D 1200 km. At 1% I.o.s what is your conclusion regarding average life of tyres?
Answer:
Given : µ = 40,000, n = 10, x̄ = 39,000, s = 1200, α = 1%
H0: Mean life of tyres is 40,000 kms(µ = 40,000)
H1: Mean life of tyres differs from 40,000 kms/(µ ≠ 40,000) (two tailed test)
Under H0 the t-test statistics is :-
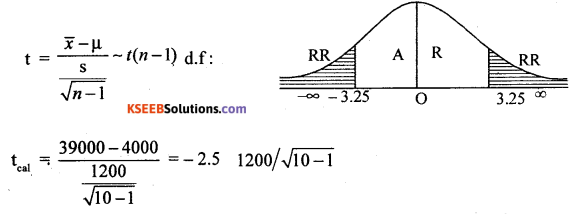
At α = 1.1 the two tail critical values for (n – 1) = 10 – 1 = 9 d.f are ±k = +3.25
Here tcal lies in Acceptance region (A.R).
∴ H0 is accepted
Conclusion: Mean life of tyres is 40,000 kms
Question 34.
For the following data find control limits of X̄ chart. (Given A2 = 0.729]

Answer:
Standards are not known, for x̄ – chart

The control limits are:
C.L = X̿ = 50,
L.C.L= X̿ – A2 R̄ = 50 – (0.729 × 5) = 46.355
U.C.L= X̿ + A2 R =50+ (0.729 × 5) = 53.645
Question 35.
Solve the following LPP graphically.
Maximize Z = 100X + 170Y ‘
s.t 2X + 3Y ≤ 36
X + 2T ≤ 20 and X,Y ≥ 0.
(For visually challenged students only)
A tailor gets a profit of Rs. 100 from a shirt and Rs. 170 from a pant. In a week of 56 hours, he uses 36 hours for cutting and 20 hours for stitching. For cutting he requires tw0 hours for a shirt and three hours for a pant. He, requires one hour to stitch a shirt and two hours to stitch a pant, formualte L.P.P.
Answer:
Consider the constraints as equalities (i.e., as equaion).
2x + 3y = 36 Co-ordinates (x, y)
put x = 0: we get y = \(\frac{36}{3}\) = 12: (0,12) .
put y = 0; we get x = \(\frac{36}{2}\) = 18; (18 , 0)
and x + 2y = 20
put x = 0 ; y = \( \frac{20}{0}\) =10; (0, 10)
put y = 0; x = 20 (20 , 0)
Also x = 0, y = 0
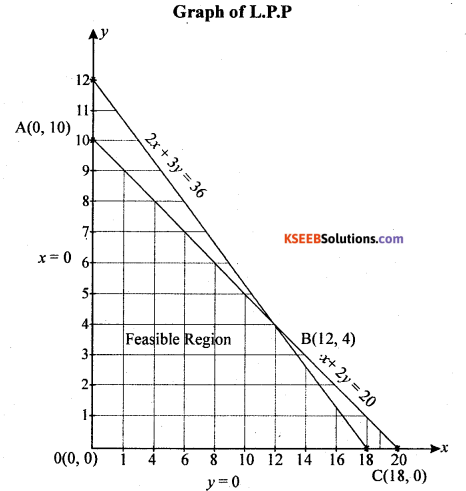
From the graph teasible region exhists at the corner points 0(0,0), A(0, 10), B( 12,4), C( 18,0) optimum value of the objective function is:
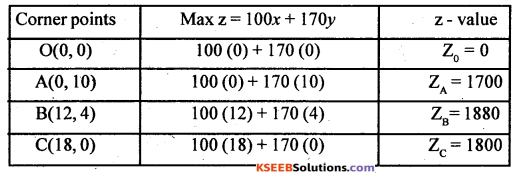
From the above table the objectivity of an L.P.P maximises at the corner point B(12,4). The optimum solution is: x= 12, y = 4 and the optimum value ZB= 1880.
For visually challenged students.
(OR)

The L.P.P is : objective function : Max z = 100x + 170y
Subject to constraints : Cutting: 2x + 3y ≤ 36
Stiching: x + 2y ≤ 20
and x ≥ 0, y ≥ 0
![]()
Question 36.
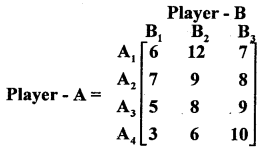
Solve the following game by dominnance rule.
Answer:
By dominance rule, all the pay-off of B1 less than all the pay-offs of B1 B3 [B1 < B2, B3]
B1 dominates B2, B3, So delete B2, B3

Pay-ofFof A2 is more than, A1, A3, A4, A2 dominates A1, A3. So, delte A1, A3
A2[7] Saddle point occurs at (2, 1)
The suggested best strategies are : for player A: A2: for player B : B1
The value of the game : V = 7
Section – D
IV. Answer any two of the foilwing questions: ( 2 × 10 = 20 )
Question 37.
Calculate GRR and NRR for the following data and comment on the result.
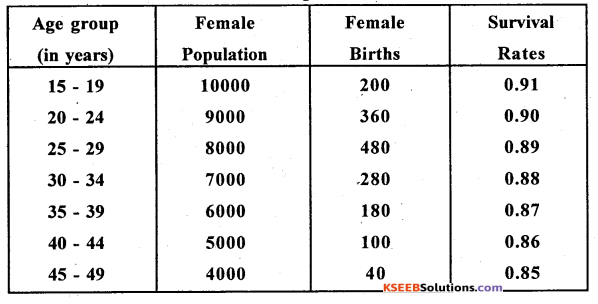
Answer:
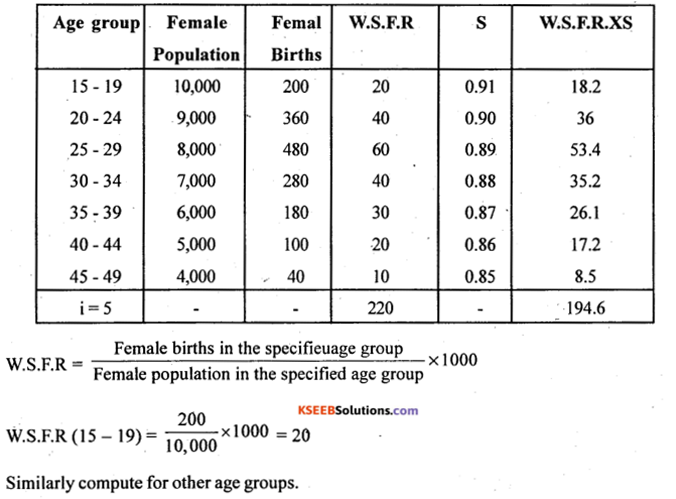
G. R.R = (i) \(\sum_{i=15}^{49}\) W.S.F.R = 5 × 220 = 1100 female
Children born per 1000 women
N.R.R = (i) \(\sum_{i=15}^{49}\) (W.S.F.R × S) = 5 × 194.6 = 973
Female children bom per 1000 women.
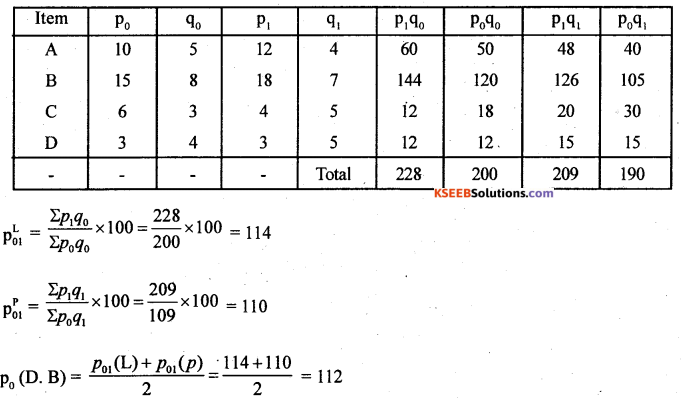
Question 38.
For the following data find Laspeyer’s, Paasche’s and Dorbish-Bowley’s price index numbers.

Answer:
Question 39.
For the following data fit a straight line trend and find trend values also estimate the production of 2017.

Answer:
Let x and y be the year and production
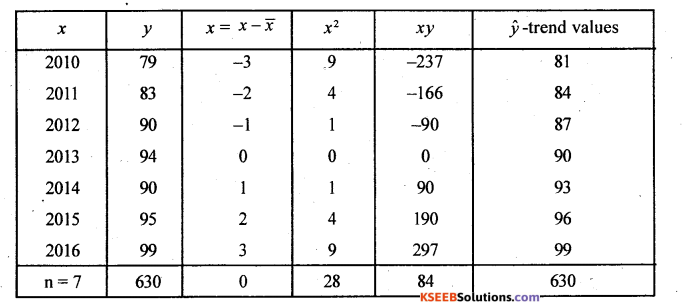
Here x̄ = 2013
From the normal equaiton na + bΣx = Σy
From Σa + bΣx2 = Σxy b = \(\frac{\Sigma x y}{\Sigma x^{2}}=\frac{84}{28}=3\)
Since Σx \(\frac{\Sigma y}{n}=\frac{630}{7}\) = 90 and
The fitted straight line trend equation is
y = a + bx : ŷ = 90 + 3x
Trend values : (2010) = 90 + 3(-3) = 81
ŷ(2011) = 90 + 3(-2) = 84.
Similarly all remaining trend values can be compated.
Estimation of production for 2017; x = 4
ŷ (2017) = 90 + 3(4) = 102 Tons.
![]()
Question 40.
(a) Five unbiased coins are tossed 128 times. Calculate the expected freuencies for the number of heads obtained. .
Answer:
Let x be the number of heads obtained is a Binomial variate is with the parameters n = 5
and p = 1/2 = 0.5 [coin is unbiased] N = 128. Then the p.m.f is :
p(x) = ncxpxqn – x; x = 0,1,2, …… n
p{x) =5cx 0.5x 0.55 – x; x = 0,1,2, …… 5
Theoretical/Expected frequency : Tx = p(x) N
T0 = p(x = 0) N = 5c00.500.55 – 0 × 128 = 4
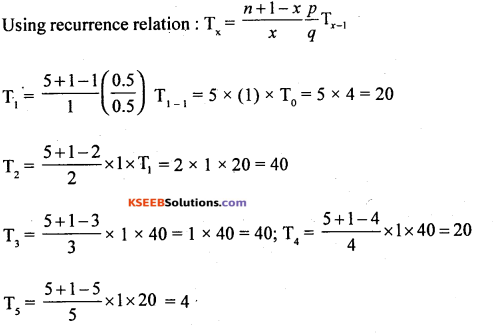
The expected frequencies of number of heads is:

(b) Seventy accidents that have occurred in a state in a week are tabulated as follows:

Test whether accident occurs uniformly throughtout the week.
[Given K2 = 16.81].
Answer:
H0 : Accidents occur uniformly throughout the week
H1 : Accidents does not occur uniformly throughout the week…(upper tail test)
The test statistic is :

Let ‘O’ and ‘E’ be the observed and expected number of accidents.
Since accidents occur uniformly throughout the week.
Expected frequencies each is \(\frac { 70 }{ 7 }\) = 10


∴ χ2cal= 6.8
For (n – 1) = (7 – 1) = 6 degrees of freedom at 1% level of significance, the upper tail critical value given k2= 16.81 (χ2tab)
Here χ2cal < k2/χ2cal lies on (AR-) acceptance region.
∴ H0 is accepted.
Conclusion: Accidents occur uniformly throughout the week.
Section – E
V. Answer any two of the following questions: ( 2 × 5=10 )
Question 41.
X is a normal variate with mean 100 and standard deviation 5. Find the probability
that (i) X ≥ 105 (ii) 90 ≤ X ≤ 110.
Answer:
X is a normal variate with the parameters
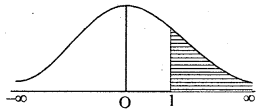
µ = 100 and σ = 5. Then S.N.V.Z = \(\frac{x-\mu}{\sigma}\) N(0,1);
\(\mathrm{z}=\frac{\mathrm{X}-100}{5}\)
(i)

= p(z > 1) = Area from 1 to ∞ = 0.1587
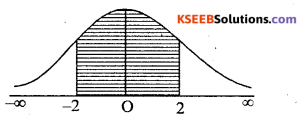
(ii)

= p(-2 < Z < 2)
= Area from (-2) to 2 = Area from (-2) to
= Area from (-2) to ∞ = 0.9772 – 0.0028 = 0.9544.
Question 42.
In a sample of 400 people ¡n Kerala 220 are tea drinkers and the rest are coffee drinkers. Can we assume that both tea and coffee are equally popular in this state?
Use 5% level of significance.
Answer:
Given : n 400, x – Tea drinkers 220, po = 0.5 [equally popular].
Sample proportion p = \(\frac{x}{n}=\frac{220}{400}\) = 0.55
H0: Tea and coffee drinkers are equally popular [Po = 0.5]
H1 : Tea and coffee drinkers are not equally poular [Po ≠ 0.5] {Two tailed test)

At α = 5% the two tail critical values are ±k = ±1.96
Here zcallies in Rejection Region (R.R). Therefore-H0: is rejected and H1: is Accepted. Conclusion: Tea and coffee drinkers are not equally popular (p0: ≠0.5)
![]()
Question 43.
For the following data test whether the attributes ‘smoking’ and literacy’ are independent. Use 1% level of significance.

Answer:
H0: Literacy and smoking are independent.
H1 : Literacy and smoking are dependent {upper tail test)
The 2 × 2 contingency table is:

Under H0 the χ2 – test statistic is

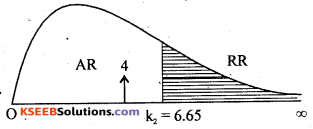
At α = 1% for 1 .d.f. the uppertail critical value k2 = 6.65
Here χ2 lies in acceptance Region (A.R)
.’. H0 is accepted
Conclusion: literacy and smoking are independent.
![]()
Question 44.
For the following transportation problem find initial basic feasible solution by NWCR method. Compute transportation cost. Is the solution degenerate?
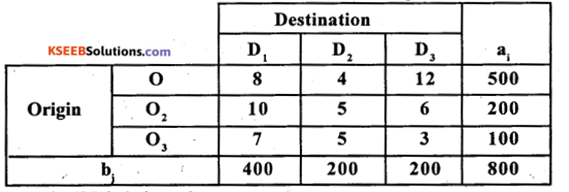
Answer:
Here Σai = Σbj the T.P is balanced
By NWCR first allocation is made at the cell (1, 1) as :
X11 min (a1 b1) = min (500,400) = 400
D1 is satisfied and replace 500 by (500 – 400) = 100
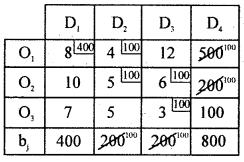
Next allocate in the same row at (1, 2).
Similarly allocations can be made.
The suggested I.B.F.S and the total transporation lost is:
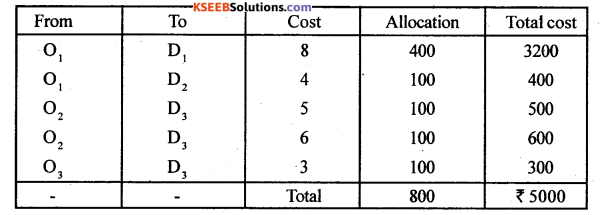
Here no. of allocation = 5 = m + n- l= Origin + Destinations = 3 + 3 – 1 = 5: Solution is Non-degenerate.