Students can Download 2nd PUC Statistics Previous Year Question Paper March 2018, Karnataka 2nd PUC Statistics Model Question Papers with Answers helps you to revise the complete Karnataka State Board Syllabus and score more marks in your examinations.
Karnataka 2nd PUC Statistics Previous Year Question Paper March 2018
Time: 3 Hrs 15 Min
Max. Marks: 100
Section – A
I. Answer ANY TEN of the following questions: (10 × 1 = 10)
Question 1.
Define cohort.
Answer:
Cohort is a group of individuals who presumed to be born at the same time and who experience the same mortality conditions.
Question 2.
What is the value of Index Number for the base year?
Answer:
100.
Question 3.
Which weights are used in the construction of Laspeyre’s Price Index Number?
Answer:
Base year quantity : q0
Question 4.
What is Time Series?
Answer:
Chronological arrangement of statistical data is called time series.
![]()
Question 5.
Under what condition Poisson distribution tends to Normal distribution?
Answer:
When λ is very large i.e., λ → ∞ poisson distribution tends to normal distribution.
Question 6.
Write the range of a Chi-square distribution.
Answer:
(0, ∞).
Question 7.
Which is the best estimator of population mean?
Answer:
Sample mean: x̄.
Question 8.
What is parameter space?
Answer:
Set of all admissible values of parameter is called parameter space.
Question 9.
In Statistical Hypothesis, if H1 : μ < 50 kg then write H0.
Answer:
H0: μ = 50.
Question 10.
What is meant by Statistical Quality Control?
Answer:
It is the method of controlling the quality of the products using statistical technique.
Question 11.
What is feasible region (FR) in LPP?
Answer:
Feasible region is the area which satistifies by all constraints and non-negativity restrictions.
Question 12.
When is a Transportation Problem (TP) balanced?
Answer:
If Σai – availiability = Σbj – Requirements, then T.P is called balanced.
Section – B
II. Answer ANY TEN of the following questions: (10 × 2 = 20)
Question 13.
Mention the methods of collecting Vital Statistics.
Answer:
- Registration method
- Census method.
Question 14.
Write any two limitations of Index Number.
Answer:
- Many formulae are used and they give different answers for the Index.
- As the customs and habits change from time to time, uses of commodities also vary.
Question 15.
For the following data compute Value Index Number: Σp0q0 = 300 and Σp1q1 = 375.
Answer:
![]()
![]()
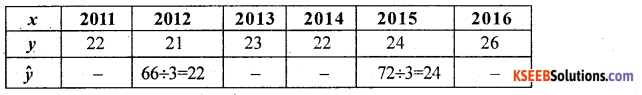
Question 16.
From the following Time Series data, calculate trends values by the method of SemiAverages
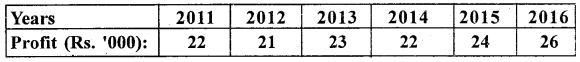
Answers:
Let x and y be year and profit, ŷ – trend analyss values
Question 17.
Define Interpolation and Extrapolation.
Answer:
Interpolation is the technique of estimating the value dependent variable(Y) for any intermediate ) value of the independent variable(X).
Extrapolation is the technique of estimating the value of dependent variable (Y) any value of independent variable (X) which is outside the given series.
Question 18.
Write down the Bernoulli distribution with parameter p – 0.4.
Answer:
p(x)= px q1-x : x = 0,1; q = 1 – p = 1 – 0.4 = 0.6
p(x)= 0.4x 0.61-x x = 0,1
OR
Question 19.
State any two features of student /-distribution.
Answer:
n is the parameter, Mean = 0, Range = (-∞, ∞)
Question 20.
Define Point estimation and Interval estimation.
Answer:
‘While estimating the unknown parameter, if a specific value is proposed as an estimate, which is called Point estimation’.
‘While estimating the unknown parameter instead of a specific value, an interval is proposed, which is likely to contain the parameter is called Interval estimation’
Question 21.
If n1 = 40, n2 = 60 and P1 = 0.02 and P2 = 0.01 then find S.E. (p1 – p2).
Answer:
S.E. (p1 – p2) = \(\sqrt{\frac{p_{1} Q_{1}}{n_{1}}+\frac{p_{2} Q_{2}}{n_{2}}}\) ∴ Q1 = 1 – P1 = 1 – 0.002 = 0.98
Q2 = 1 – P2 = 1 – 0.01 = 0.99
S.E (p1 – p2) = \(\sqrt{\frac{0.02 \times 0.98}{40}+\frac{0.01 \times 0.99}{60}}\) = 0.0256
Question 22.
What do you mean by Process control and Product control?
Answer:
Controlling the quality of the product during the manufacturing process itself is called process control.
Controlling the quality of the finished products/manufactured products is called product control.
Question 23.
The objective function and two solutions of an LPP are Max Z = 5X + 4Y and A(12,10); B(14, 4). Find the optimal solution.
Answer:
ZA = 5(12) + 4(10) = 100; ZB = 5(14) + 4(4) = 86.
ZA is maximum. The optimal solution is at A: x = 12, y = 10.
Question 24.
From the following Transportation Problem test whether solution is degenerate.
Answer:
Number of allocations = 4
m(rows) + n(columns) – 1 = 3 + 3 – 1 = 5
Here allocations ≠ m+n-1, the solution is degenerate.
Section – C
III. Answer any ten of the following questions: (8 × 5 = 40)
Question 25.
From the following data calculate Crude Birth Rate (CBR) and General Fertility Rate (GFR):
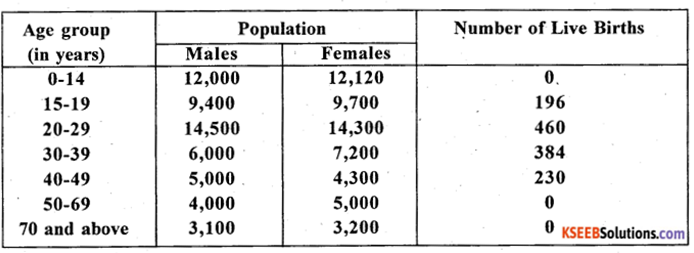
Answer:
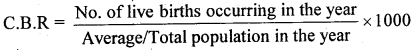
= \(\frac{1270}{54,000+55,820}\) × 1000 = 11.564 Births/1000 population
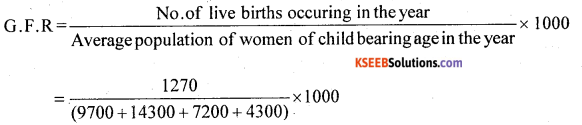
= 35.7746 Births/1000 population of women of child bearing age.
Question 6.
Calculate Un-weighted geometric mean price index number for the following data.
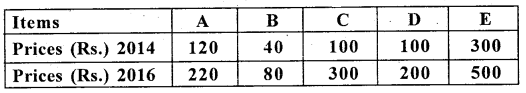
Answer:
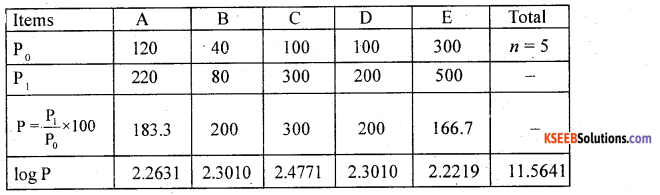
Unweighted G.M. P.I No: P01 = AL \(\left[\frac{\sum \log \mathrm{P}}{n}\right]\)
= AL \(\left[\frac{11.5641}{5}\right]\) = AL [2.3128] = 205.4944
![]()
Question 27.
What is Consumer Price Index Number (CPI)? Write its four uses.
Answer:
Refer Page No 47. Q.No. 09 and 17
Question 28.
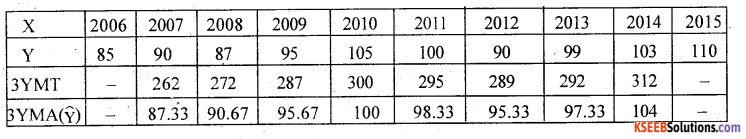
Compute the trend values by finding 3 yearly moving averages for the following data.
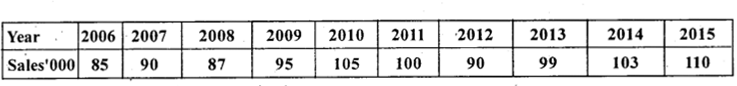
Answer:
Let X and Y be the year and sales
Question 29.
Interpolate and Extrapolate the population of India for the census years 1981 and 2021 from the following data.

Answer:
Let X and Y be the census year and population
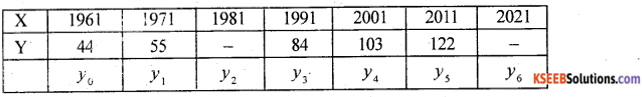
Number of known values ofy.n = 5. The Binomial expansion (y- 1)5 = 0;
y5 – 5y4 + 10y3 – 10y2 + 5y1 – y0 = 0 ………. (1)
122 – 5(103)+ 10(84)- 10y2 + 5(55) – 44 = 0
122 – 515 + 840 – 10y2 + 275 – 44 = 0; – 10y2 + 678 = 0
∴ y = 67.8 crores is the population in 1981.
From equation (1) suffixes of y are increased by 1.
We get: y6 – 5y5 + 10y4 – 10y3 + 5y2 – y1 = 0
y6 – 610 + 1030 – 840 + 339-55 = 0
y6 – 136 = 0 ∴ y6 = 136 crores is the population in 2021.
Question 30.
The number of accidents in a year attributed to taxi drivers in a city follows Poisson distribution with mean 2.5. Out of 2000 taxi drivers, find approximately the number of drivers with
(a) One accident,
(b) More than 2 accidents in a year
Answer:
Let X be the number accidents follows poisson distribution with the parameter λ = 2.5, N = 2000
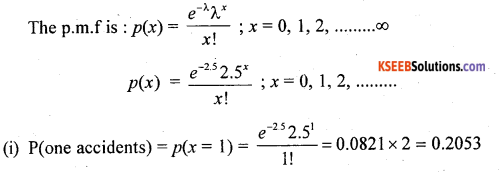
No. of drivers with one accident = 0.2053 x 2000 = 410.6 = 411
(ii) P(more than 2 accidents) = p(x > 2) = 1 – p(x ≤ 2)
= 1 – [p(x = 0) + p(x = 1) + p(x = 2)]
= 1- e-25 [1+2.5 +3.125] = 1 – 0.0821 × 6.625
= 1 – 0.5439 = 0.4561
No. of drivers with more than 2 accidents = 0.4561 × 2000 = 912.2.
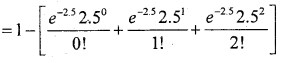
Question 31.
In a Hyper Geometric distribution, if a = 6, b = 9 and n = 4 then find
(a) P(X = 2)
(b) Standard Deviation
Answer:
![]()
Question 32.
A manufacturer claims that less than 2% of the products are defective. A retailer buys a hatch of 400 products from the manufacturer and find that 12 are defectives. Test at 1% level of significance that whether the manufacturer claims is justifiable.
Answer:
Given: P = 2% = 0.0 2, Q = 0.98, n = 400, x = 12 and so p = \(\frac{x}{n}=\frac{12}{400}\) =o.03, ∝ = 1%
H0: 2% of the products are defective (P = 0.02)
H1 : less than 2% of the products are defective (P < 0.02) {Lower tail test -K}
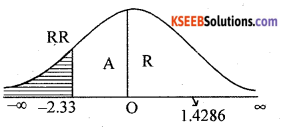
Under H0 the test statistic is:-
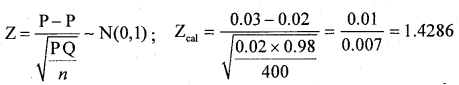
At ∝ = 1% the lower tail crtical value -K = -2.33
Here Zcal lies in (Acceptance Region)
∴ H0 is accepted.
Conclusion: 2% of the products are defective (P = 0.02)
Question 33.
A random sample of size 16 has mean 53. The sum of the squared deviations taken from mean is 150. Can this sample be regarded as taken from the population having mean 56? (K = ±2.13)
Answer:
Given :n= 16, x̄ = 53, Σ(X— X̄)2 =150, µ = 56
H0: Population mean = µ = 56
H1 : Population mean differs from µ ≠ 56 {Two tailed test ± K = ± 2.13)
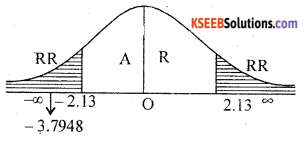
Under H0, the test statistic is
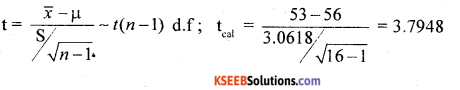
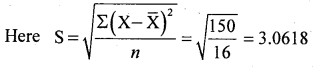
Critical Values ± K = ±2.13 given.
Here tcal lies in R.R (Rejection Region)
∴ H0 is rejected and H1 is accepted
Conclusion: Population mean differs from µ ≠ 56
Question 34.
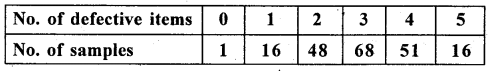
Ten samples of size 50 each were inspected and the number of defectives in each of them was as follows.
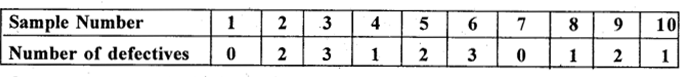
Obtain the control limits for np-chart.
Answer:
Given: No. of defectives: Σd= 15, Sample no. K = 10 and n- 50
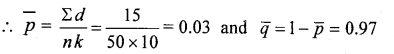
Standard not known, the control limits for np-chart are:
C.L = np̄ = 50 × 0.03 = 1.5
L.C.L = np̄ – 3\(\sqrt{n \bar{p} \bar{q}}\) = 50 × 0.03 – 3\(\sqrt{50 \times 0.03 \times 0.97}\) = -2.118 = 0 [Takenas’0′]
U.C.L = np + 3\(\sqrt{n \bar{p} \bar{q}}\) = 50 × 0.03 + 3\(\sqrt{50 \times 0.03 \times 0.97}\) = 5.1187
Question 35.
Solve the following game by Maxi-min and Mini-max principle. Is game fair?
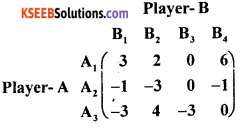
Answer:
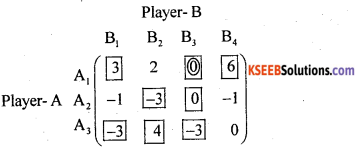
By Maxi min-minimax principle –
- Maximin (∝) – minimum pay-off in each row is/are circled.
- Minimax(β)-Maximum pay-off in each column is/are boxed.
- Saddle point occurs at (1,3). Here pay-off ‘0’ is circled as well as boxed.
- Suggested optimal strategies for the players are: For player A-A1, For players B-B3
- Value of the game: V = 0, yes the game is fair.
Question 36.
The capital cost of a machine is Rs. 10,500. Its resale value is Rs. 500. The maintenance costs are as follows:
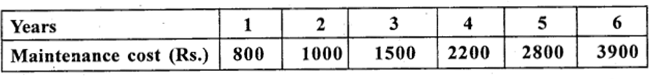
When should the machine be replaced?
Answer:
Given: P = 10,500, Sn= 500 and so (P – Sn) = (10,500 – 500) = 10,000 is fixed for all the years.
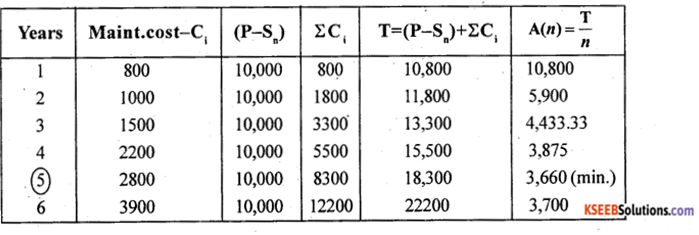
From the above table the annual average maintenance cost A(n) is minimum for n = 5, is the optimal period for replacement of the machine and A(5) = ₹ 3,660/-
![]()
Section-D
IV. Answer any two of the following questions: (2 × 10 = 20)
Question 37.
(a) From the following data show that Town-A is healthier.
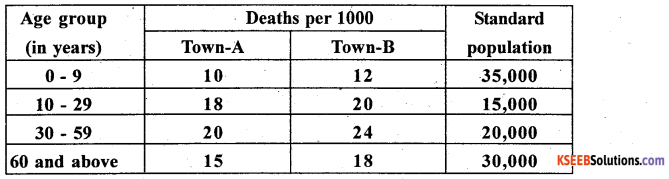
Answer:
Here Deaths per 1000 are A.S.D Rs of Town A and B as A,B; Ps be the standard population
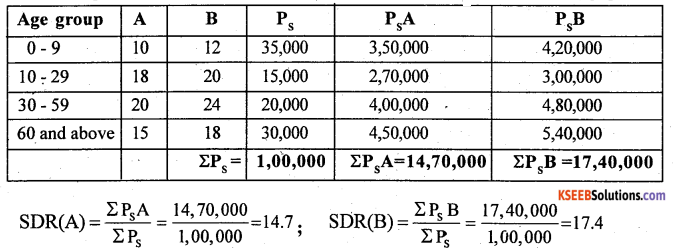
Here SDR (A) < SDR (B , so town – A is healthier
(b) Compute the Gross Reproduction Rate (GRR) from the following data
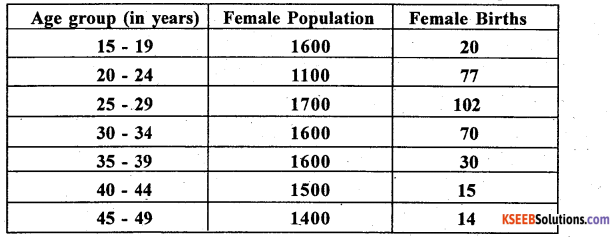
Answer:
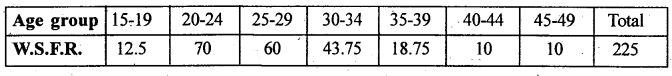
Here , W.S.F.R – Women Specific fertility rate
W.S.F.R.(15-19)= \(\frac { 20 }{ 1600 }\) × 1000 = 12.5 1600
Similarly W.S.F.Rs can be calculated for the other age groups.
![]()
i = age width = 5; ΣW.S.F.R = 225
G.R.R = 5 × 225 = 1125 Female births/1000 Women population.
Question 38.
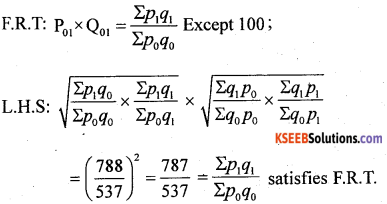
Compute Fisher’s Price Index Number. Show that Fisher’s Index Number satisfies TRT and FRT.
Answer:
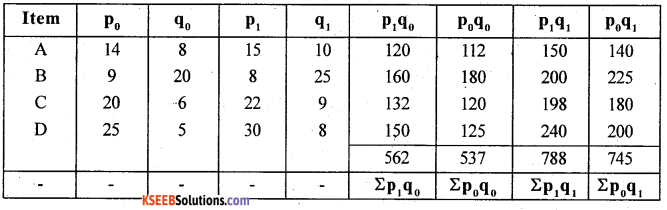
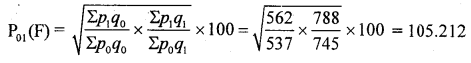
T.R.T: p01 × p1o = 1 Except 100
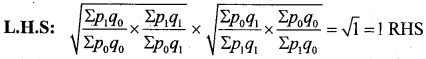
Satisfies T.R.T
Question 39.
Fit a parabolic trend of the form Y = a + bX + cX2 for the following Time Series.
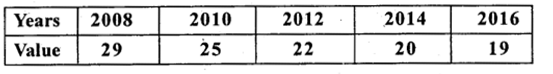
Answer:
Let x and y be the year and production
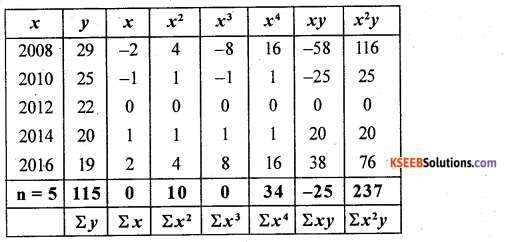
From the normal equation na + bΣx + cΣx2 = Σy; 5a + b.0 + c. 10 = 115
5a + 10c = 115 … (1) From: aΣx + bΣx2 + cΣx3 = Σxy
a.0 + b. 10 + c.0 = -25; b = -2.5 and From: aΣx2 + bΣx3 + cΣx4 = Σx2y ;
a. 10 + b.0 + c.34 = 237; 10a + 34c = 237 … (2)
from(l) and (2) 5a + 10c=115 × 2
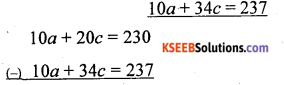
0 – 14c = -7; ∴ c = 0.5; Put c = 0.5 in (1)
5a + 10(0.5)= 115; a = 22
The fitted parabolic trend equation is:-
y = a + bx + cx2; y =22 – 2.5x + 0.5x2
![]()
Question 40.
Fit a Binomial distribution for the following data and test at 5% level of significance that Binomial distribution is a good fit.
Answer:
Let x be the number of defective items is a Binomial variate with the parameter n = 5, and P is obtained as below:
Let f be the number of samples, then from the frequency distribution:
![]()
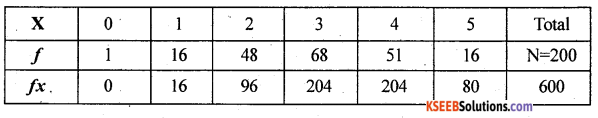
5p = \(\frac { 600 }{ 200 }\) , p = \(\frac { 3 }{ 5 }\) = 0.6, q=0.4
200 5
Then the p.m.f is:-
p(x) = nCxpx qn-x; x = 0,1,2 ….. n
p(x) = 5Cx 0.6x 0.455 – x; x = 0,1,2, 5
Theoretical frequency : Tx = p(x) N
T0 = 5C0 0.60 0.45-0 × 200 = 2.048
Using recurrence relation :
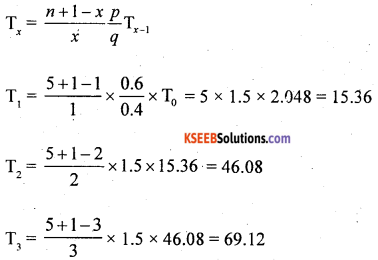
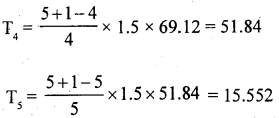
The fitted observed and theoretical frequency distribution (Approx) is:
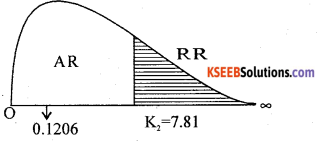
CHI-SQUARE TEST:
H0: Binomial distribution is good fit (0i = Ei)
H1 Binomial distribution is not good fit (0i ≠ Ei) {upper tail text K2}
Under H0, the χ2-test statistic is:-
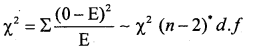
since P is estimated/calculated from the data and so (n – 1 – 1) = (n-2) d.f
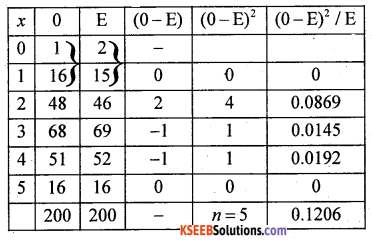
χ2cal =0.1206
At ∝ = 5% for (n- 2) = 5-2 = 3 d.f the upper tail critical value K2= 7.81
Here χ2cal lies in AR (Acceptance region).
Therefore H0 is accepted.
Conclusion: B.D is a good fit.
Section-E
V. Answer any two of the following questions: (2 × 5 = 10)
Question 41.
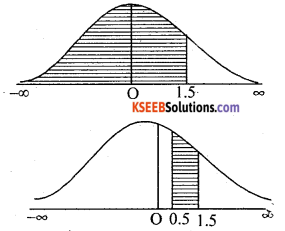
X is a normal variate with parameters mean (μ) = 50 and variance (σ2) = 16. Find the probability that
Answer:
Given: μ = 50, Variance = σ2 = 16; σ = 4
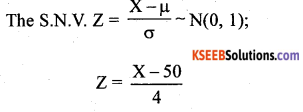
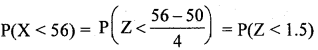
= Area from 1.5 to (-∞)
= 1 – 0.0668 = 0.9332
(ii) P(52 < X < 55) = P\(\left(\frac{52-50}{4}<Z<\frac{55-50}{4}\right)\)
= p(0.5 < Z < 1.25)
= Area from 0.5 to ∞ -Area from 1.25 to ∞
= 0.3085 – 0.1056 = 0.2029
Question 42.
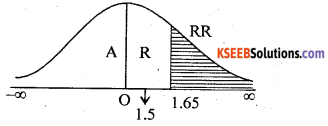
From the following data regarding average weight of boys and girls. Test whether the mean weight of boys are greater than mean weight of girls.
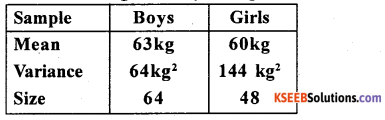
Answer:
Let n1 = 64, n2 = 48, x̄1, = 63, x̄2 = 60, S12 -64, S22 = 144 .
H0: Mean weight of boys and girls are same (µ1 = µ2)
H1 : Mean weight of boys is more than girls (µ1 > µ2) {upper tail test ± K}
Under H0 the test statistic is :
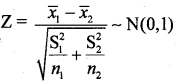
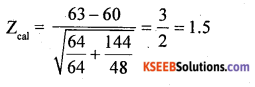
At ∝ = 5% the upper tail critical value K = 1.65
Here Zcal lies in A.R (Acceptance region).
∴ H0 is Accepted.
Conclusion: Mean weight of boys and girls are same.
![]()
Question 43.
To test the effectiveness of vaccination against Tubeculosis (TB) and following data was obtained.

Test at 1% level of significance whether vaccination and attack of TB are independent.
Answer:
H0: Vaccination and attack of T.B are independent.
H1 : Vaccination and attack of T.B are dependent
The given data can be written under 2 × 2 contigency table as below:-
The 2 × 2 contingency table is:
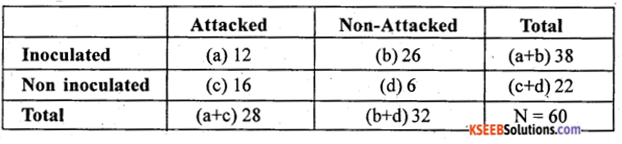
From the contingency table the χ2 – test statistic is –
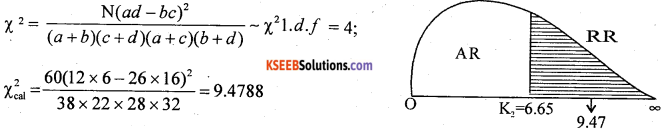
At ∝ = 1% for l.d.f. the uppertail critical value K2 = 6.65
Here χ2cal lies in R.R (rejection region)
∴ H0 is rejected and H1 is accepted.
Conclusion: Vaccination and attack of T.B. are independent.
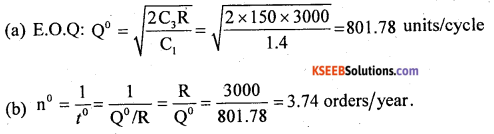
Question 44.
The annual demand for an item is 3000 units. Capital cost is Rs. 7 per unit. Inventory carrying cost is 20% of capital cost per annum. If setup cost is Rs. 150 then find
(a) Economic Order Quanity and
(b) Optimum number of orders.
Answer:
Given: R = 3000/year, P = 7, I = 20% per year
C1 = PI = 7 × 20% = 1.4/year, C3 = 150
Shortages not allowed use E.O.Q model I