You can Download KSEEB Solutions for Class 8 Maths Chapter 15 Introduction to Graphs InText Questions and Answers helps you to revise the complete syllabus.
KSEEB Solutions for Class 8 Maths Chapter 15 Introduction to Graphs InText Questions
Try These (Page 244)
Question 1.
(i) Let us take a suitable scale on both axes (Fig. 15.16).
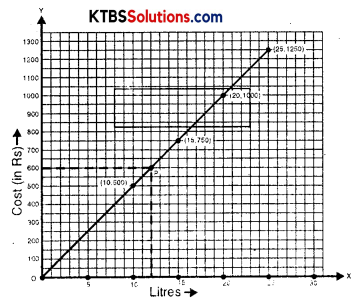
(ii) Mark the number of liters along the horizontal axis.
(iii) Mark the cost of petrol along the vertical axis.
(iv) Plot the points: (10, 500), (15, 750), (20, 1000), (25, 1250).
(v) Join the points.
Solution:
We find that the graph is a line. (It is a linear graph). Why does this graph pass through the origin? Think about it.
This graph can help us to estimate a few things. Suppose we want to find the amount needed to buy 12 liters of petrol. Locate 12 on the horizontal axis.
Follow the vertical line through 12 till you meet the graph at P (say).
From P you take a horizontal line to meet the vertical axis. This meeting point provides the answer.
This is the graph of a situation in which two quantities, are in direct variation. (How?). In such situations, the graphs will always be linear.
![]()
Try These (Page 244)
Question 1.
In the above example, use the graph to find how much petrol can be purchased for Rs. 800.
Solution:
16 liters of petrol can be purchased for Rs. 800.
Try These (Page 245)
Question 1.
(Principal and Simple Interest)
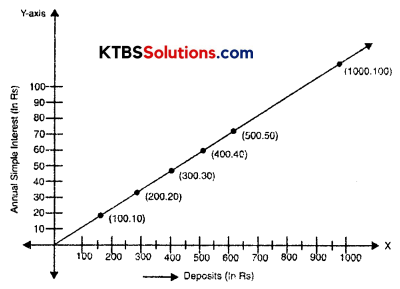
A bank gives 10% Simple Interest (S.I.) on deposits by senior citizens. Draw a graph to illustrate the relation between the sum deposited and simple interest earned. Find from your graph
(a) the annual interest obtainable for an investment of Rs. 250.
(b) the investment one has to make to get an annual simple interest of Rs. 70.
Solution:
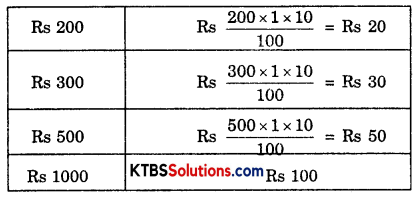
Sum deposited = Rs. 100
Simple interest for a year = Rs. \(\frac{100 \times 1 \times 10}{100}\) = Rs. 10
Steps to follow:
1. Find the quantities to be plotted as Deposit and SI.
2. Decide the quantities to be taken on the x-axis and on the y-axis.
3. Choose a scale.
4. Plot points.
5. Join the points.
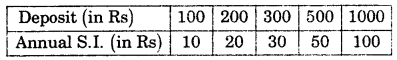
We get a table of values.
(i) Scale: 1 unit = Rs. 100 on horizontal axis; 1 unit = Rs. 10 on vertical axis.
(ii) Mark Deposits along the horizontal axis.
(iii) Mark Simple Interest along the vertical axis.
(iv) Plot the points: (100, 10), (200, 20), (300, 30), (500, 50) etc.
(v) Join the points. We get a graph that is a line (Fig. 15.17).
(a) Corresponding to Rs 250 on the horizontal axis, we get the interest to be Rs 25 on the vertical axis.
(b) Corresponding to Rs 70 on the vertical axis, we get the sum to be Rs. 700 on the horizontal axis.
![]()
Try These (Page 245)
Question 1.
Is Example 7, a case of direct variation?
Solution:
Yes, this is a case of direct variation.