Students can Download Maths Chapter 13 Statistics Ex 13.2 Questions and Answers, Notes Pdf, KSEEB Solutions for Class 8 Maths helps you to revise the complete Karnataka State Board Syllabus and score more marks in your examinations.
Karnataka Board Class 8 Maths Chapter 13 Statistics Ex 13.2
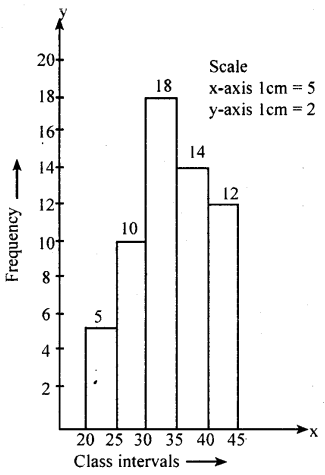
Question 1.
Draw a histogram to represent the following frequency distribution.
| Class interval | Frequency |
| 20-25 | 5 |
| 25-30 | 10 |
| 30-35 | 18 |
| 35-40 | 14 |
| 40-45 | 12 |
Answer:
Question 2.
Draw a histogram to represent the following frequency distribution.
a
| Class interval | Frequency |
| 10- 19 | 7 |
| 20-29 | 10 |
| 30-39 | 20 |
| 40-49 | 5 |
| 50-59 | 15 |
Answer:
The given distribution is in the inclusive form.
d = lower limit of a class – upper limit of a class before it = 20 – 19
d = 1 , 

| Stated class interval | Actual class | Frequency |
| 10- 19 | 9.5 – 19.5 | 7 |
| 20-29 | 19.5-29.5 | 10 |
| 30-39 | 29.5 – 3u9.5 | 20 |
| 40-49 | 39.5 -49.5 | 5 . |
| 50-59 | 49.5 – 59.5 | 15 |
