You can Download KSEEB Solutions for Class 8 Maths Chapter 15 Introduction to Graphs Ex 15.3 Questions and Answers helps you to revise the complete syllabus.
KSEEB Solutions for Class 8 Maths Chapter 15 Introduction to Graphs Ex 15.3
Question 1.
Draw the graphs for the following tables of values, with suitable scales on the axes.
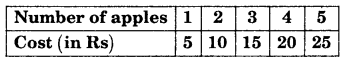
(a) Cost of apples
(b) Distance travelled by car
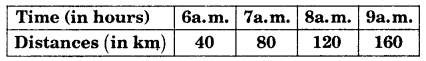
(i) How much distance did the car cover during the period 7.30 a.m. to 8 a.m.?
(ii) What was the time when the car had covered a distance of 100 km since its start?
(c) Interest on deposits for a year.
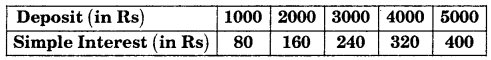
(i) Does the graph pass through the origin?
(ii) Use the graph to find the interest on Rs 2500 for a year.
(iii) To get an interest of Rs 280 per year, how much money should be deposited?
Solution:
(a)
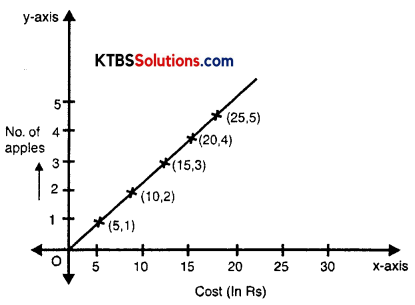
(x-axis) Horizontal 1 unit = Rs. 5
(y-axis) Vertical 1 unit = 1 apple
(b)
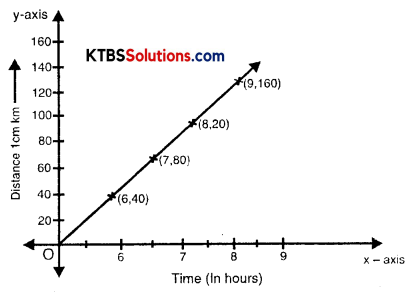
(i) At 7 o’clock distance is 80 km and at 7.30 am distance covered is 100 km. 8 o’ clock car covers distance 120 km. So between 7:30 a.m to 8:00 o’ clock distance covered = 120 – 100 = 20 km.
(ii) It was 7:30 a.m.
(c)
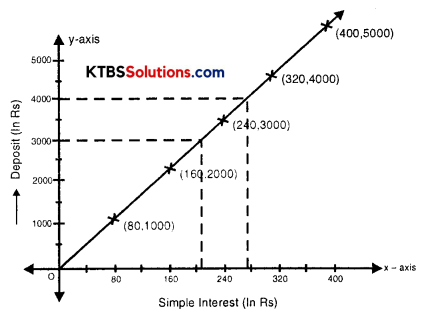
(i) Yes, graph passes through the origin.
(ii) Interest in Rs 2500 is Rs. 200.
(iii) To get interested of Rs 280 per year one has to deposit Rs 3500.
![]()
Question 2.
Draw a graph for the following.
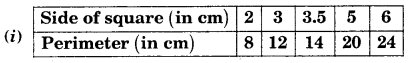
Is it a linear graph?
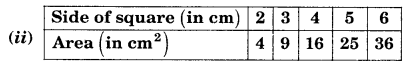
Is it a linear graph?
Solution:
(i)
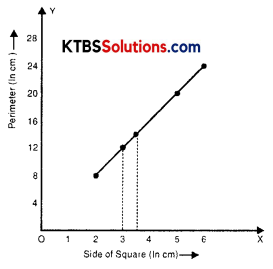
Yes, it is a linear graph.
(ii)
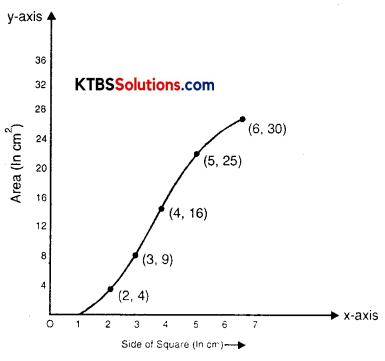
No, it is not a linear graph.