You can Download KSEEB Solutions for Class 8 Maths Chapter 5 Data Handling InText Questions and Answers to help you to revise the complete syllabus.
KSEEB Solutions for Class 8 Maths Chapter 5 Data Handling InText Questions
Try These (Page 71)
Question 1.
Draw an appropriate graph to represent the given information.
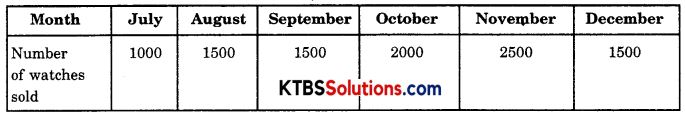
Solution:
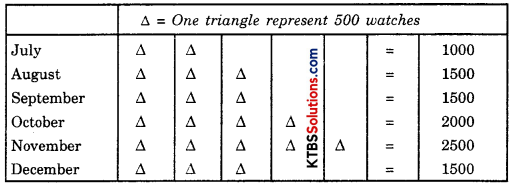
A pictograph represents well the given data
Question 2.
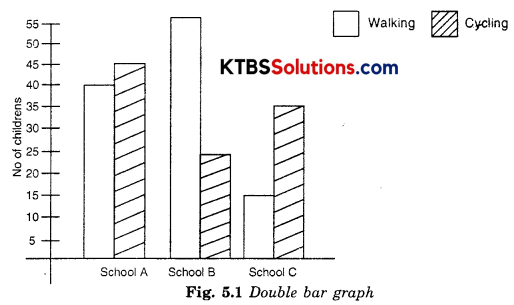
Draw the graph to represent the given information.
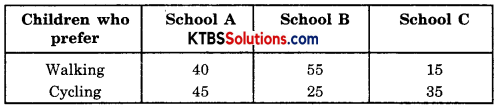
Solution:
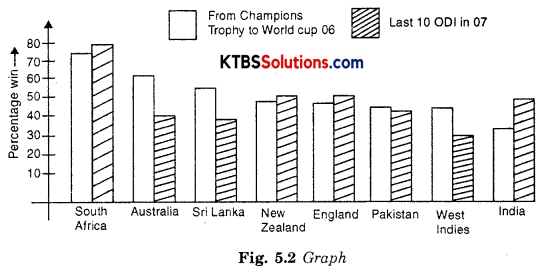
Question 3.
Draw the graph to represent the given information.
Percentage wins in ODI by 8 top cricket teams.
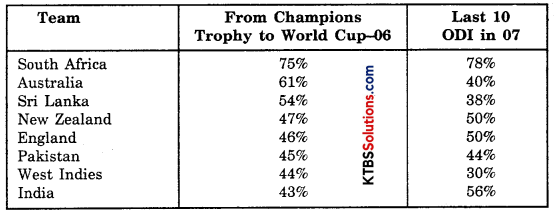
Solution:
Try These (Page 72)
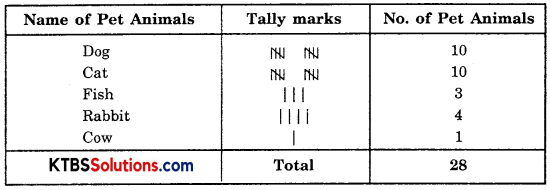
Question 1.
A group of students was asked to say which animal they would like most to have as a pet. The results are given below:
dog, cat, cat, fish, cat, rabbit, dog, cat, rabbit, dog, cat, dog, dog, dog, cat, cow, fish, rabbit, dog, cat, dog, cat, rabbit, cat, fish, dog. Make a frequency distribution table for the same.
Solution:
Try These (Pages 73 – 74)
Question 1.
Study the following frequency distribution table and answer the questions given below:
Frequency Distribution of Daily Income of 550 workers of a factory
Table 5.3
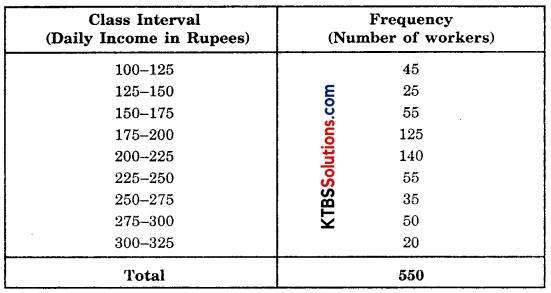
(i) What is the size of the class intervals?
(ii) Which class has the highest frequency?
(iii) Which class has the lowest frequency?
(iv) What is the upper limit of the class intervals 250 – 275?
(v) Which two classes have the same frequency?
Solution:
(i) Class size is 25
(ii) 200 – 225
(iii) 300 – 325
(iv) 250
(v) 150 – 175 and 225 – 250
![]()
Question 2.
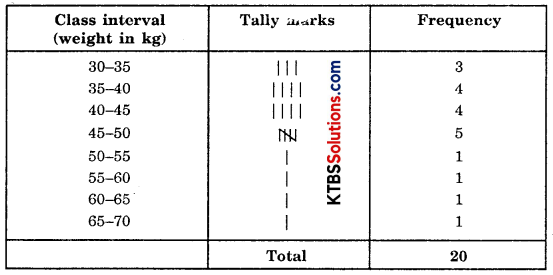
Construct a frequency distribution table for the data on weights (in kg) of 20 students of a class using intervals 30 – 35, 35 – 40, and so on.
40, 38, 33, 48, 60, 53, 31, 46, 34, 36, 49, 41, 55, 49, 65, 42, 44, 47, 38, 39.
Solution:
Try These (Pages 75 – 76)
Question 1.
Observe the histogram (Fig. 5.3) and answer the questions given below:
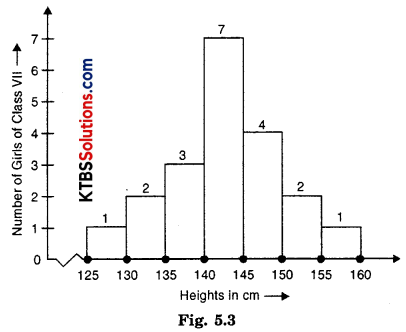
(i) What information is being given by the histogram?
(ii) Which group contains maximum girls?
(iii) How many girls have a height of 145 cm and more?
(iv) If we divide the girls into the following three categories, how many would there be in each?
150 cm and more — Group A
140 cm to less than 150 cm — Group B
Less than 140 cm — Group C
Solution:
(i) Histogram shows the height (in cm) for a number of girls of class VII.
(ii) 140 – 145
(iii) Number of girls have height 145 cms and more = 4 + 2 + 1 = 7
(iv) 150 cm and more — Group A — 3 girls
140 cm to less than 150 cm — Group B — 11 girls
Less than 140 cm — Group C — 6 girls
![]()
Try These (Page 78)
Question 1.
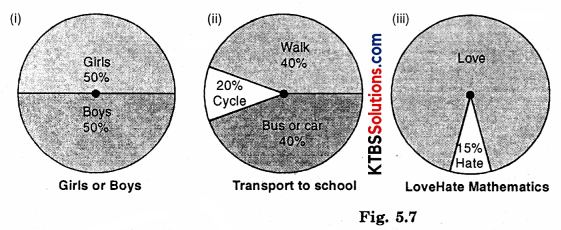
Each of the following pie charts (Fig. 5.5) gives you a different piece of information about your class. Find the fraction of the circle representing each of this information.
Solution:
(i) (a) The proportion of sector for girls = \(\frac{\text { percentage of girls }}{\text { Total }}=\frac{50}{100}=\frac{1}{2}\)
(b) The proportion of sector for boys = \(\frac{500}{100}=\frac{1}{2}\)
(ii) (a) The proportion of sector for walking = \(\frac{\text { Walking % }}{\text { Total } %}=\frac{40}{100}=\frac{2}{5}\)
(b) The proportion of sector for bus or car = \(\frac{40}{100}=\frac{2}{5}\)
(c) The proportion of sector for cycle = \(\frac{20}{100}=\frac{1}{5}\)
(iii) (a) The proportion of sector for love = \(\frac{85}{100}=\frac{17}{20}\)
(b) The proportion of sector for hate = \(\frac{15}{100}=\frac{3}{20}\)
![]()
Question 2.
Answer the following questions based on the pie chart given (Fig. 5.8).
(i) Which type of programmes are viewed the most?
(ii) Which two types of programmes have a number of viewers equal to those watching sports channels?
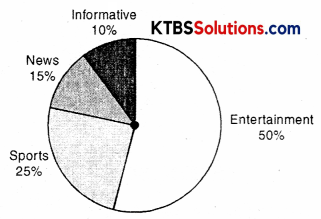
Fig. 5.8 Viewers watching different types of channels on TV.
Solution:
(a) Entertainment
(b) News and information channels together have an equal number of viewers to those watching sports channels.
Try These (Page 81)
Question 1.
Draw a pie chart of the data given below.
The time spent by a child during a day
Sleep — 8 hours
School — 6 hours
Homework — 4 hours
Play — 4 hours
Others — 2 hours
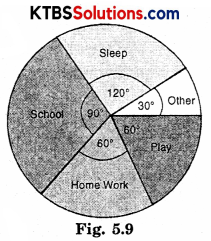
Solution:
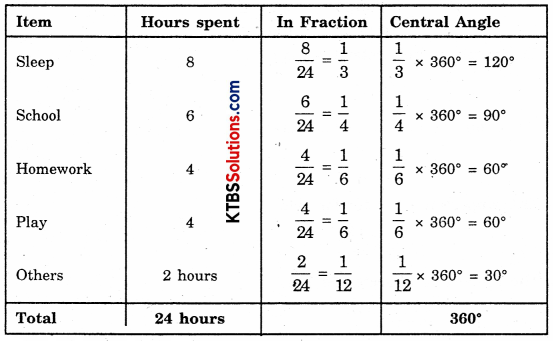
The pie chart of the data
Try These (Page 83)
Question 1.
If you try to start a scooter, what are the possible outcomes?
Solution:
The possible outcome is that the scooter will either start or will not start.
![]()
Question 2.
When a disc is thrown, what are the six possible outcomes?
Solution:
Six possible outcomes are 1, 2, 3, 4, 5, 6
Question 3.
When you spin the wheel shown, what are the possible outcome (Fig. 5.15) List them?
(Outcome here means the sector at which the pointer stops).
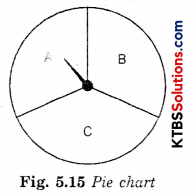
Solution:
Possible outcomes are pointer will either stop at A, B, or C.
Question 4.
You have a bag with five identical balls, of different colours and you are to pull out (draw) a ball without looking at it; list the outcomes you would get (Fig. 5.16)
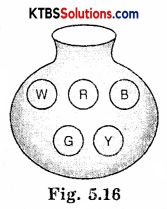
Solution:
Possible outcomes are: Red ball, White ball, Blue ball, Green ball, or Yellow ball (W, R, B, G, Y)
So, a total of five outcomes is possible.
Try These (Page 86)
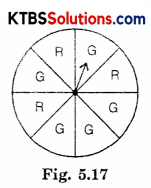
Suppose you spin the wheel
Question 1.
(i) List the number of outcomes of getting a green sector and not getting a green sector on this wheel (Fig. 5.17).
(ii) Find the probability of getting a green sector.
(iii) Find the probability of not getting a green sector.
Solution:
(i) Total number of outcomes = 8
Number of outcomes of getting green sectors = 5
Number of outcomes of do not getting green sector = 3 (Red sectors)
(ii) Probability of getting a green sector = \(\frac{5}{8}\)
(iii) Probability of not getting a green sector = \(\frac{3}{8}\)