You can Download Chapter 5 Analysis of Univariate Data Questions and Answers, Notes, 1st PUC Statistics Question Bank with Answers Karnataka State Board Solutions help you to revise complete Syllabus and score more marks in your examinations.
Karnataka 1st PUC Statistics Question Bank Chapter 5 Analysis of Univariate Data
1st PUC Statistics Analysis of Univariate Data Textbook Questions and Answers
Question 1.
What do you mean by ‘Central tendency’ and ‘Measure of central tendency’?
Solution:
In any frequency distribution most of the frequencies are concentrated at the centre, this property of concentration of the frequencies around the centre is called Central tendency.
The central value representing the majority of the frequencies/values is called Measure of central tendency or Average.
Question 2.
What is an average?
Solution:
The central value representing the majority of the values/frequencies is called Average.
Question 3.
What are the various measures of central tendency?
Solution:
a. Arithmetic mean
- Median
- Mode
- Geometric mean
- Hormonic mean
Question 4.
What are the desired characteristics/properties/essentials of good measure of central tendency?
Solution:
- It is rigidly defined.
- It is simple to understand and easy to calculate
- It should be based on all values of the data
- It should not be affected by the extreme values of the data
- It should have sampling stability
- It should be capable of further statistical analysis
Question 5.
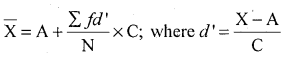
Define Arithmetic mean and give the formula
Solution:
Arithmetic mean is defined as the sum of values divided by the number of values. Denoted by-
∴ \(\overline{\mathrm{X}}=\frac{\Sigma \mathrm{X}}{\mathrm{n}}\)
Question 6.
Write the properties of a good measure of central tendency.
Solution:
- It is rigidly defined
- It is based on all values of the data
- It should not be affected by the extreme values of the data
- It should have the sampling stability
- It should be capable of further statistical analysis
Question 7.
Write any two merits and demerits of A.M Sol.
Solution:
Merits:
- It is simple to calculate and easy to understand
- It is rigidly defined/It is based on all values.
Demerits:
- It is.affected by extreme values of the data.
- It cannot be easily calculate for the distribution with open-end class interval.
![]()
Question 8.
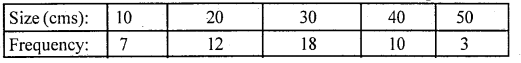
Define Median and give the formula.
Solution:
Median is defined as that value of the data, which divides the data into two equal parts, when the data is arranged in ascending order.
Denoted by ‘M’
M = size of the \(\left(\frac{n+1}{2}\right)^{t h}\) item / term; n – Number of items
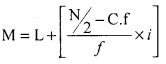
For continuous data :Median class = Size of the \(\left(\frac{\mathrm{N}}{2}\right)^{\mathrm{th}}\) item / term
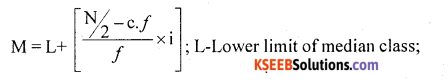
c.f- cum. frequency up to median Class;
f-freq. med. Class;
i-width of med. class
Question 9.
Give any two merits and demerits of Median.
Solution:
Merits:
- It is rigidly defined
- It is not affected by extreme values
De-merits:
- It is not based on all observations
- It has no sampling stability
Question 10.
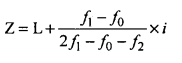
Define Mode and give the formula.
Solution:
Mode is defined as that value of the data, which occurs more frequently, OR Which occurs greatest number of times. Denoted by ‘Z’
For Ungrouped data: Z= Size of the data which more frequently
For Discrete data: Z= Size of the highest frequency
For Continuous Data: Modal class = Size of the highest frequency
f0-freq. preceding class; f1– frequency of the modal class;
f2-frequency, succeeding to Mod. C1ass i- width of Modal class
Question 11.
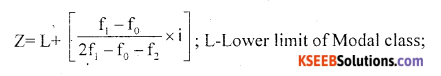
Define Harmonic mean with formula.
Solution:
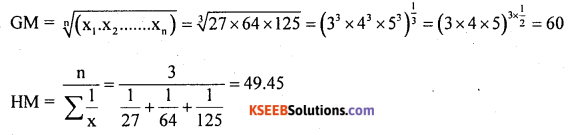
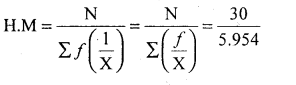
Harmonic mean is defined the reciprocal of the Arithmetic mean of the reciprocal alues of the – data
![]()
Question 12.
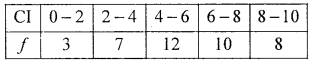
Define Geometric mean with formula.
Solution:
Geometric mean is defined as the nth root of the product of ‘n‘ if number of observations. If x2,x1,………xn are the‘n’number of observations then,
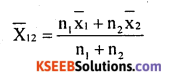
ie. GM =\(\sqrt[n]{\left(x_{1} \cdot x_{2} \dots \dots x_{n}\right)}\)
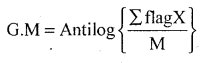
Using Logarithms, GM= Antilog {\(\frac{\Sigma \mathrm{Logn}}{\mathrm{n}}\)}
Question 13.
Give any two uses of G.M and H.M
Solution:
GM and HM are used to calculate the averages, where very accurate values are needed, in cases of Time, Velocity’, Speed, Bank rates, Interest rates etc.
Question 14.
What is the relation between AM, GM and HM.
Solution:
x̄ ≥ GM ≥ HM
Question 15.
Write down Empirical relation between mean, median and mode
Solution:
Mode = [3 Median – 2 Mean]
Question 16.
Give any two uses of Mode
Solution:
Mode is used to find the true characteristics in any manufacturing industries, such as to find the most common size in ready made garments, Shoes, any items etc.
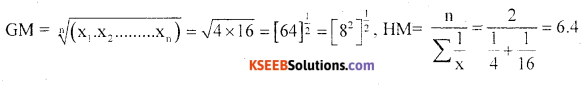
Question 17.
Calculate G.M and 1I.M:4,16
Solution:
Question 18.
Find GM. and H.M:27,64,125
Solution:
Question 19.
What is the weighted A.M and mention its uses
Solution:
When the relative importance/weights/weightages of the various items used in finding the averages are required, Weighted averages are used.
Let X1, X2, ….. Xn are the number of values with respective weights assigned as W1, W1………..Wn
Then Weighted Arithmetic Mean is – x̄w = \(\frac{\Sigma \mathrm{WX}}{\Sigma \mathrm{W}}\)
Question 20.
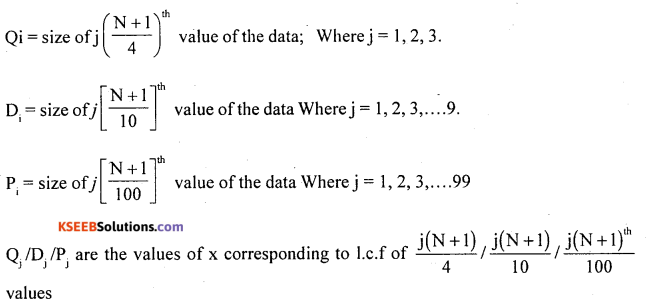
Give the formula for calculating combined A.M for two set of values.
Solution:
![]()
Question 21.
What do you mean by partition values?
Solution:
If the data is divided into various parts, the dividing points are called partition Values. The partition values are Median, Quartiles, Deciles and Percentiles.
Question 22.
What are partition values?
Solution:
The partition values are Median, Quartiles, Deciles and Percentiles
Question 23.
Define Quartiles, Deciles and Percentiles.
Solution:
Quartiles: If the data is divided into four equal parts with three dividing points, then the dividing points are called Quartiles. The first dividing point is Q1 the second dividing point is Q2/Median and the third dividing point is Q3
Deciles: If the data is divided into ten equal parts with nine dividing points, the dividing points are called Deciles. They are denoted by D1, D2…D9
Similarly Percentiles can be defined.
Question 24.
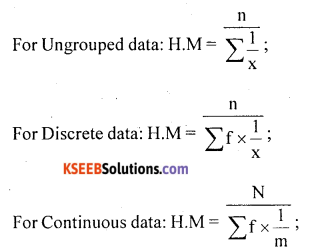
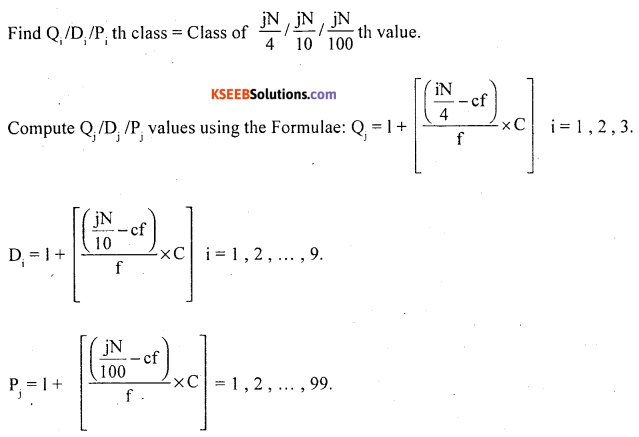
Write down formula for calculation of partition values in general, for disrete and continuous data.
Solution:
I. For Ungrouped data
Arrange the data in ascending order (Array).
For Quartiles: Qj = size of \(\frac{n+1}{4}\) th value of the data; Where j= 1,2,3.
For Deciles: Dj = size of j(n+l )/10th th value of the data Where j = 1,2, 3,….9.
For Percentiles : Pj = size of j[latex]\frac{n+1}{4}[/latex]th Value of the data Where j = 1,2,3,…..9.
II. For Discrete data:
Calculate Less than Cumulative Frequency.
III. For Continuous Data:
Calculate the Continuous frequency.
![]()
Problems
Question 1.
Following mark of 8 students compute mean marks: 84, 75,45,42,59,62,55,50.
Solution:
Direct method : X = \(\frac{\sum x}{n}\)
Let x be the marks : No. of students = 8
Mean Marks = X = \(\frac{472}{8}\) = 59
Question 2.
Find mean weight (kgs) : 53, 52.4, 54 50.8 + 48.4 + 44.4
Solution:
Direct method: X = \(\frac{\sum x}{n}\)
Let X be the weight (in kgs), n- No. of students = 6
:. Mean weight (in kgs) x̄ = \(\frac{\sum x}{n}\) = \(\frac{303}{6}\) = 50.5 kgs
Question 3.
Following ¡s em penses of 8 workers:
Empenses ( ₹ ): 12500,8500, 10,400,6000,8000,5000,4400,9200. compute mean empcnsc.
Solution:
The data is big in size, so use
Shortcut method: X = A + \(\frac{\Sigma d}{n}\) ;d=X – A
A – Arbitrary assumed mean
Let X be the monthLy expenditure
| X | D= X – A(8000) |
12500 8500 10400 6000 8000 5000 4400 9200 | 4500 500 2400 -2000 0 -3000 -3600 1200 |
| n = 8 | Σd = 8600 – 8600 = 0 |
A = 8000 (Assume any value within the data)
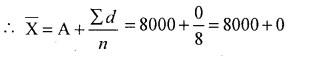
∴ Mean.expenditure : x̄ = ₹ 8000
Question 4.
The priers of gold obseredover 10 days gave the following data. Compute ’mean prime of gold per 10 gram:
2750,2600,2580,2700,2850,2680,2900,2575,2950,2720
Solution:
Use shortcut method :\(\overline{\mathrm{X}}=\mathrm{A}+\frac{\sum d}{n}\)
Let X denote the mile (x̄).
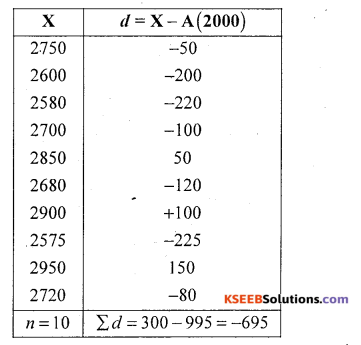
A = 2800 (Assume within highest and lowest value in the data)
Mean price of gold (x̄) = ₹ 2830.5
Question 5.
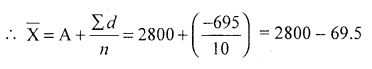
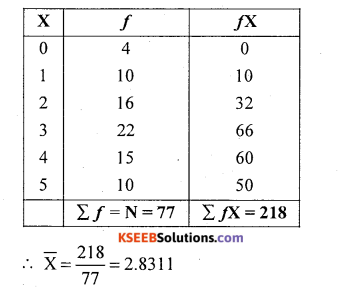
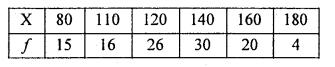
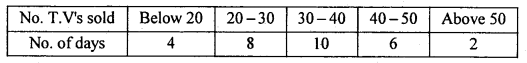
Following is the T.V sets sold over number of day. Comput mean No. of sets sold per day.
Solution:
Let X and f be the no. of t.v. sets sold and no. of days.
The data is small in size.
Use direct method : x̄ = \(\frac{\sum f x}{\mathrm{N}}\)
![]()
Question 6.
Number of students attended over a month is reconded as below. Compute mean number of students attendence per day.
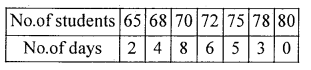
Solution:
Let X and f be the attendance of students and no. of students.
∴ Mean number of students attended (x̄) = 71.5357
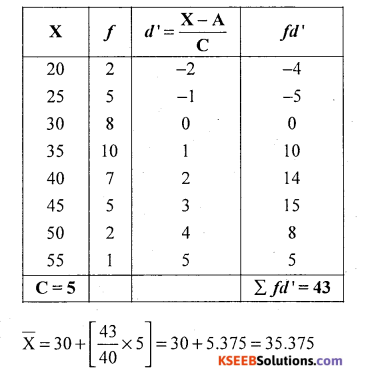
Question 7.
Find mean:
Solution:
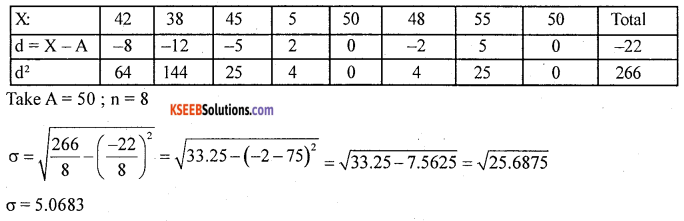
The data having common difference so, usr deviation method
C – Common difference
A – Arbitrary assumed mean.
Let X and/be number of passengers and number of trips.
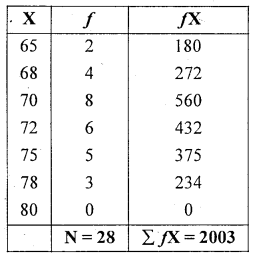
Question 8.
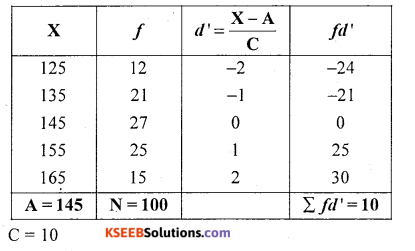
Find the Arithmetic mean:

Solution:
Let X and f be the values and frequency
Question 9.
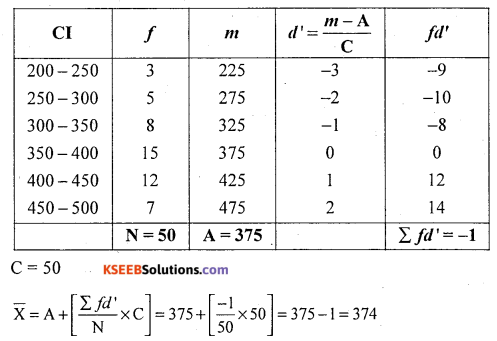
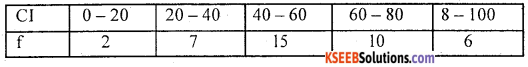
From the following frequency distribution compute mean.
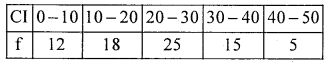
Solution:
Let class intervals (Cl) and/be the marks and number of students.
![]()
Question 10.
Solution:
Question 11.
The number of workers and duty wages are given below compute mean
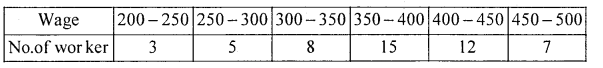
Solution:
Let Cl and f be the daily wages and no. of workers
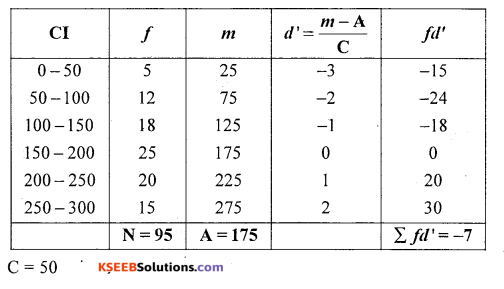
Question 12.
The number of worker and daily expenses are recorded below: compute mean
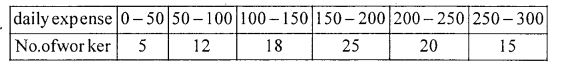
Solution:
Let Cl and f be the daily expenses and no. of workers
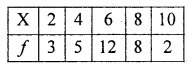
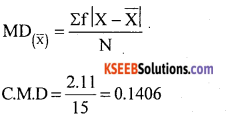
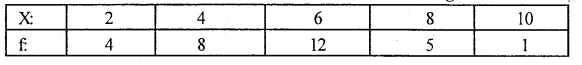
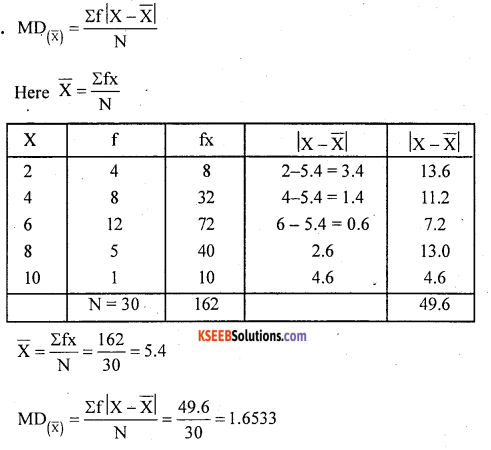
Question 13.
Calculate the mean for 2, 4, 6, 8, 10
Solution:
Question 14.
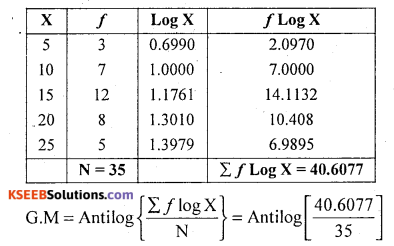
Calculate the geometric mean of the following series of monthly income of a batch of families: 180,250,490, 1400, 1050. Using logarithmic method.
| X | logx |
| 180 | 2.2553 |
| 250 | 2.3979 |
| 490 | 2.6902 |
| 1400 | 3.1461 |
| 1050 | 3.0212 |
| Σ logx = 13.5107 | |
Solution:
GM=Antilog [Xlogx/n] = Antilog [ 13.5107/5] = Antilog(2.7021) = 503.6
![]()
Question 15.
Calculate the average income per head from the data given below .Use geometric mean.
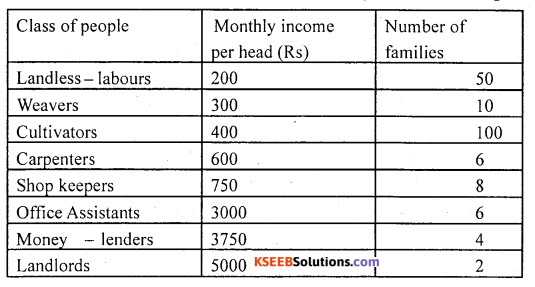
Solution:
Let X and f the income (Rs) and Number of families.
GM = Antilog {\(\frac{\Sigma f \log x}{N}\)}
G.M = Antilog \(\left[\frac{\Sigma f \log x}{N}\right]\)= Antilog \(\left[\frac{482.257}{186}\right]\) = Antilog (2.5928)
GM=Rs 391.50
Question 16.
From the given data calculate H.M 5,10,17,24,30
Solution:
| X | 1/X |
| 5 | 0.2000 |
| 10 | 0.1000 |
| 17 | 0.0588 |
| 24 | .0.0417 |
| 30 | 0.0333 |
| Total | 0.4338 |
Question 17.
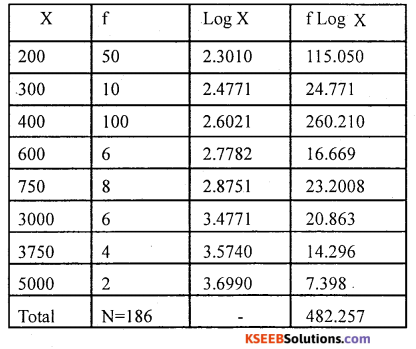
The marks secured by some students of a class are given below. Calculate the harmonic mean.
Solution:
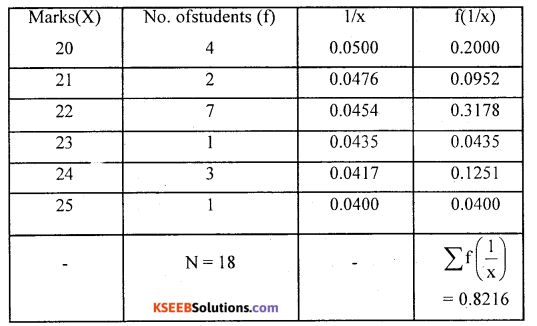
H.M = N/(f.1/x) = 18/0.1968 = 21.91
![]()
Question 18.
From the following take of literacy rate and number of cities compute median
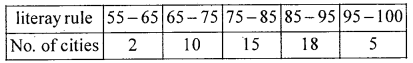
Solution:
Let C.I and f be the literary rate (%) and no. of cities
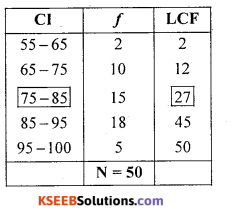
LCF (Less than cumulative frequency)
Median class = size of Nth term = \(\frac{50}{2}=\) = 25th term
(25th term includes in LCF of 27 group i.e., all 13 to 27 terms)
∴ Median class = 75-85
L – Lower limit of median class = 75
\(\frac{N}{2}=\) = 25; C.f – Cumulative frequency upto median class = 12
f – Simple frequency of median class =15 i
i – Width of the median class = 10
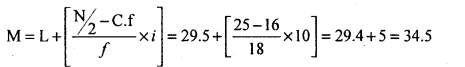
M = 75 + [\(\frac{25-12}{15}\)+ x 10] = 75 + 8.667 = 83.667
Question 19.
The age of students are given below compute median
Solution:
Let Cl and f be the age (years) and number of students
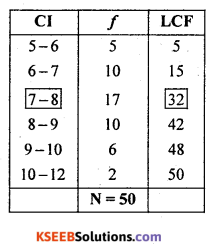
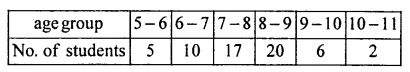
Median class = Size of term = \(\left(\frac{\mathrm{N}}{2}\right)^{\mathrm{th}}\) term = \(\frac{50}{2}\) = 25th term = 7-8
(25th term is in the group of 32 of LCF i.e., all values from 16 to 32 lies in the group)
Question 20.
From the following data compute median
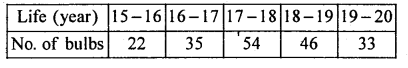
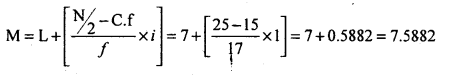
Solution:
Let Cl and f be the Life and number of bulbs
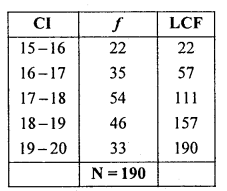
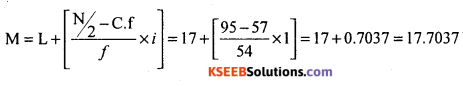
Median class = Size of term = \(\left(\frac{\mathrm{N}}{2}\right)^{\mathrm{th}}\) term = \(\frac{190}{2}\) = 95th term = 17-18
Question 21.
Find the median
Solution:
Let Cl and/be the marks and number of students
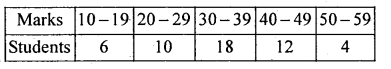
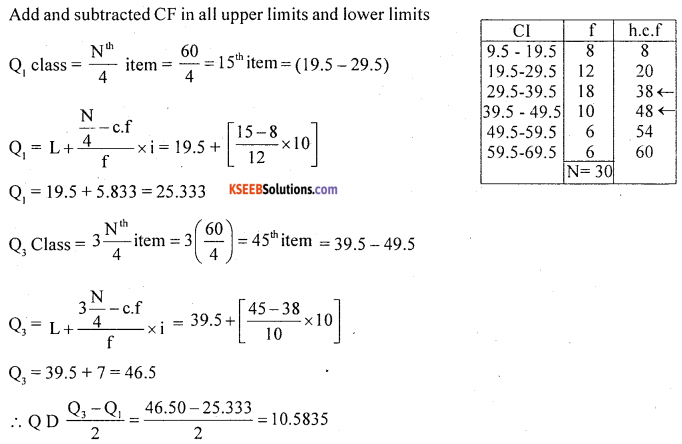
Here class interval is (Cl) are inclusive, so convert into exclusive C.I use, correction factor

Subtract C.F. in all lower limits and add to all upper limits in all inclusive class intervals.
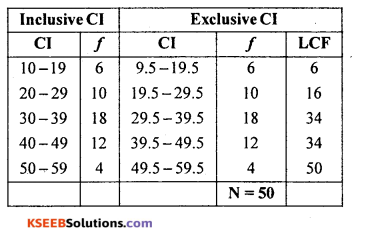
Median class = Size of term = \(\left(\frac{\mathrm{N}}{2}\right)^{\mathrm{th}}\) term = \(\frac{50}{2}\) = 25th term = (29.5 – 39.5)
![]()
Question 22.
Find median : 23, 27, 15, 18, 25, 28, 30, 20
Solution:
Arrange in ascending order
15, 18, 20, 23,25, 27, 28, 30 ;n = 8
Question 23.
Find the median : 75,80,81,75,75,88,75,84,74,70
Solution:
Arrange in ascending order
70, 74, 75, 75, 75, 75, 80, 81, 82, 84
n = 10
Question 24.
Find the median :
Solution:
(Discrete data)
First calculate LCF (Less than cumulative frequency); add frequencies from top
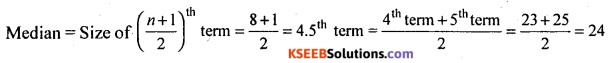
Median = size of \(\left(\frac{\mathrm{N}+1}{2}\right)^{\mathrm{th}}\) term
![]()
Median
Question 1.
Compute median for the following data
No. of apples per box : 22,18,25,32,28,26,30
Solution:
Ungrouped/Raw data
Arrange in ascending order n = 7
No. of apples per box: 18,22,25, [26], 28, 30, 32
Median = Size of \(\left[\frac{\mathrm{N}+1}{10}\right]^{\mathrm{th}}\) term = \(\frac{7+1}{2}\) = 4th term
∴ Median = 26 apples per box.
Median = \(\left(\frac{40+1}{2}\right)^{\text {th }}\) term = 25.5th term.
Here 20.5 lies in the group of 29 of LCF., its value at X is median.
∴ Median 15.
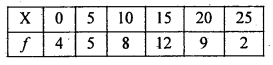
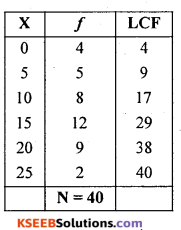
Question 2.
Find the median for the following frequency distribution.
Solution:
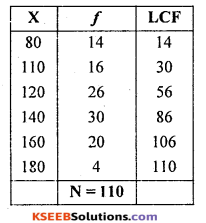
Median = Size of \(\left[\frac{\mathrm{N}+1}{10}\right]^{\mathrm{th}}\) term = \(\frac{110 +1}{2}\) = = 55.5th term
∴ Median = 120.
![]()
Mode
Question 1.
Find the value made for the following ungroupcd data: 25,14,33,40,35,28,42,40,62,38,40,35
Solution:
(Ungrouped/Raw data)
Mode = Size of most repeated term
Mode(Z) = 40 [It is more no. of times]
Question 2.
Following is the data regarding the no. of childern per couple. Find medal number of children:
4,1,0,2, 5,2, 5, 2,1,2,1,5, 4,2,1,2
Solution:
Mode = Size of most repeated term
∴ Mode (Z) = 2
Question 3.
Find the value of mode :
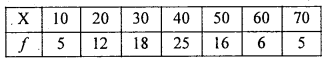
Solution:
(Discrete data)
Mode = Size of highest frequency
Highest frequency is 25, its size (X) is 40.
∴ Mode (Z) = 40
Question 4.
Find mode number of children per family
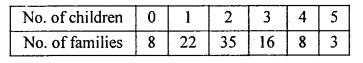
Solution:
Mode = Size of highest frequency.
Let X and f be the number of children and number of families.
Highest frequency is 35, its size (X) is Z.
∴ Mode(Z) = 2 children per family.
![]()
Question 5.
Find the mode:
Solution:
(Continuous data)
First find the medal class :
Medal class = Size of highest frequency
Apply the formula:
Let X and f be size and no. of items
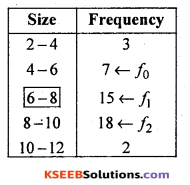
Medal clas = 6 – 8 [It has highest frequency]
L = 6 ® Lower limit of medal class
f0 = 1 ® Frequency preceeding to model class
f1 = 15 ® Frequency of the model class
f2 = 10 ® Frequency succeeding to model class
i = 2 Width of the medal clas [i.e., 8 minus 6] = 2
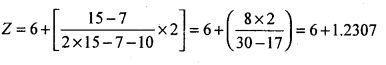
∴ Z = 11.2307 is the modal size of items.
Question 6.
On 30 days of business hours, the number of T.V sets sold in a certain show room arc as given below.
Solution:
Let X and f be the number of t.v’s sold and no. of days
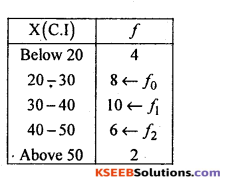
Modal class = Size of highest frequency
= 30 – 40 [This class has highest frequency]
Z = 33.3333 is the modal no. of T.V’s sold in a shop.
![]()
Question 7.
Calculate the production of sugar from the following data
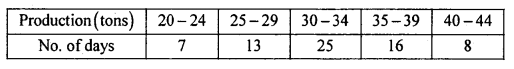
Solution:
Let X and /be the production and number of days.
The frequency distribution is of inclusive class intervals. So convert into exclusive class intervals. Using correction factor (CF)
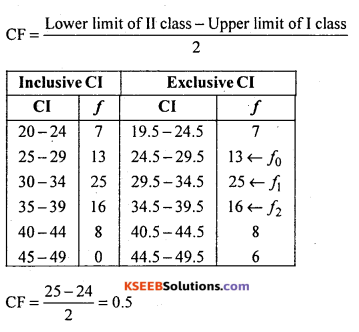
Subtract CF in all lower limits and add to all upper limits.
Medal class = Size of highest frequency = (29.5 – 34.5)
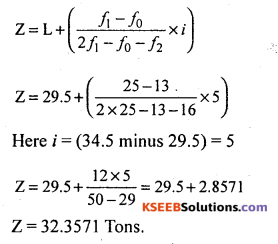
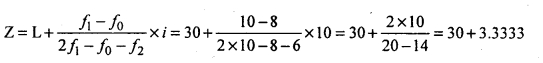
Question 8.
Find the mode:
Solution:
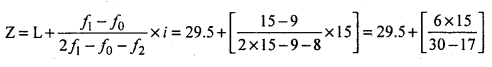
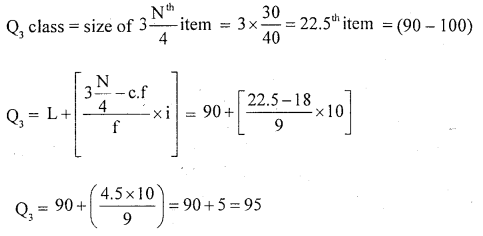
Convert inclusive class into exclusive class intervals
C.F = \(\frac{\text { LL II class -UL I class }}{2}=\frac{15-4}{2}\) = 0.5
Subtract CF = 0.5 in all lower limits and add to all upper limits.
| X | f |
| (-0.5) – 14.5 | 4 |
| 14.5-29.5 | 9 ← f0 |
| 29.5-44.5 | 15 ← f1 |
| 44.5-59.5 | 8 ← f2 |
| 55.5-74.5 | 4 |
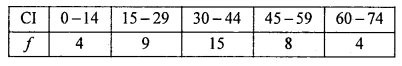
Medal class = Size of highest frequency = (29,5 – 44.5)
Z = 29.5+ 6.9230 = 36.423.
Question 9.
Calculate mode :
Solution:
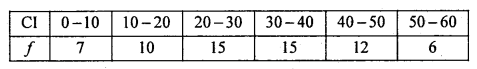
In the above frequency distribution there are two highest frequencies, the data is called Bi-medal. To find mode use empirical relation between mean, median and mode:
Z = 3 median – 2 mean
Z = 3m – 2x̄
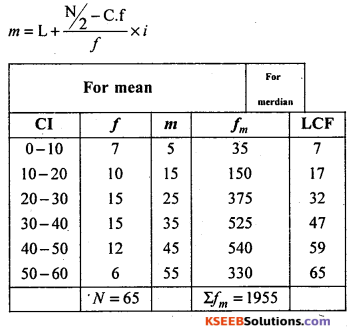
\(\overline{\mathrm{x}}=\frac{\Sigma f_{m}}{\mathrm{N}}\); m- midpoints
After calculating LCF
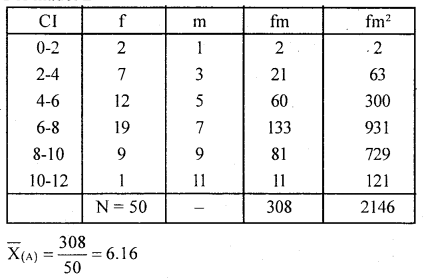
LCF = Frequencies added from top
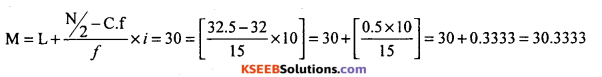
\(\overline{\mathrm{X}}=\frac{\sum f_{m}}{\mathrm{M}}=\frac{1955}{65}\) = 30.0769
Median class = Size of \(\left(\frac{\mathrm{N}}{2}\right)^{\mathrm{th}}\) term = \(\frac{65}{2}\) = 32.5th term
Here 32.5 is not in the group of 32 of LCF but in the group of 47.
So, median class = 30-40
Now mode (Z) = 3 m – 2x̄
= 3(30.3333) – 2(30.0769)
= 90.9999 – 60.1538
Z = 30.3333
Note : Calculation of mode for indefined data we can also use grouping and analysis table method, but for IPUC it is limited study.
![]()
Question 10.
Calculate mean, median and mode
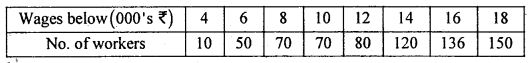
Solution:
The distribution is of less than cumulative type, i.e., upper limits and frequencies added from top are given. Convert it to simple frequency distribution.
The distribution is ill defined for mode use empirical relation.
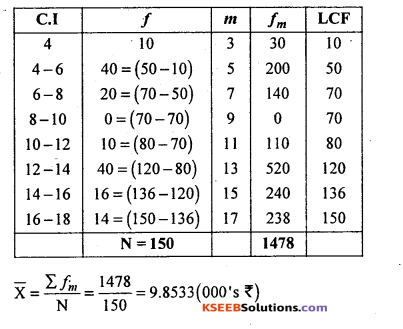
Median class = Size of \(\left(\frac{\mathrm{N}}{2}\right)^{\mathrm{th}}\) term = \(\frac{150}{2}\) = 75th term
= 10-12
M=11(000’s)
∴Mode(Z) = 3m – 2x̄ = 3(11) – 2(9.8533) = 33 – 19.7066
= 13.2934 (000’s’).
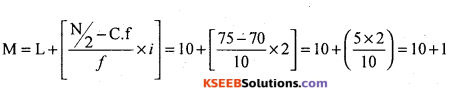
Question 11.
Calculate mean, median and mode for the following frequency distribution
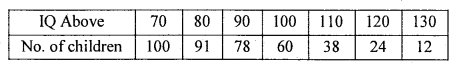
Solution:
The given table is more than cumulative frequency distribution. Convert into simple frequency distribution (i.e., lower limits and frequencies added from below are given)
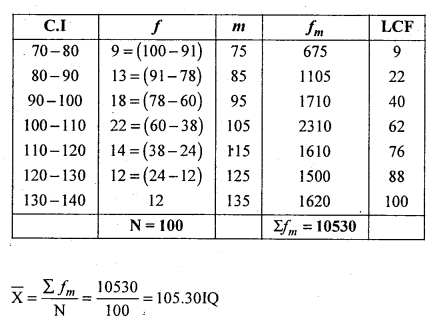
Median class = Size of \(\left(\frac{\mathrm{N}}{2}\right)^{\mathrm{th}}\) term = \(\frac{100}{2}\) = 50th term = (100-110)
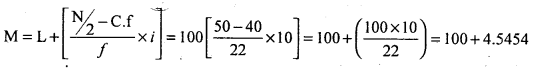
M= 104.5454IQ
Median class = Size of highest frequency = 100 – 110
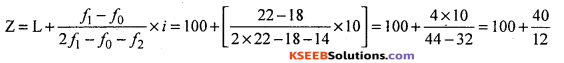
Z = 100 + 3.3333 = 103.3333IQ
![]()
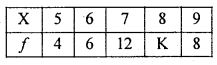
Question 12.
Given x̄ = 7.3, Fing the missing frequency
Solution:
Solution:
Let k be the missing Frequency
| X | f | fx |
| 5 | 4 | 20 |
| 6 | 6 | 36 |
| 7 | 12 | 84 |
| 8 | K | 8K |
| 9 | 8 | 72 |
| N = 30 + K | ΣfX = 212 + 8K |
\(\overline{\mathrm{x}}=\frac{\Sigma f \mathrm{x}}{N}\)
7.3 = \(\frac{212+8 K}{30+K}\)
7.3(30 + K) = 212 + 8K
219 + 7.3K = 212 + 8K
-8K + 7.3K = 212 – 219
– 0.7K = -7
K = \(\frac{7}{0.7}\) = 10
K = lo is the missing frequency
Question 13.
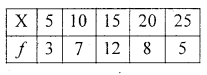
Find the missing frequency if the mean is 18.4
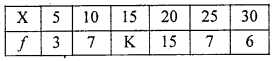
Let k be the missing Frequency
| X | f | fx |
| 5 | 3 | 15 |
| 10 | 7 | 70 |
| 15 | K | 15K |
| 20 | 15 | 300 |
| 25 | 7 | 175 |
| 10 | 6 | 180 |
| N = 38 + K | 740 + 15K |
\(\overline{\mathrm{x}}=\frac{\Sigma f \mathrm{x}}{N}\)
18.4 = \(\frac{740+15 K}{38+K}\)
18.4(38 + K) = 740 + 15K
18.4 × 38+ 18.4K = 740 + 15K
699.2 + 18.4K = 740 + 15K
18.4K = 740 – 699.2 – 15.K
3.4K = 40.8
K = \(\frac{40.8}{3.4}\)
K = 12 is the missing frequency.
Question 14.
Find the missing frequency from the following frequency distribution if x̄ = 24.
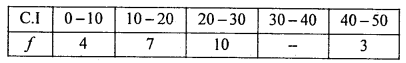
Solution:
Let K be the missing frequency
\(\overline{\mathrm{X}}=\frac{\sum f_{m}}{\mathrm{N}}\)
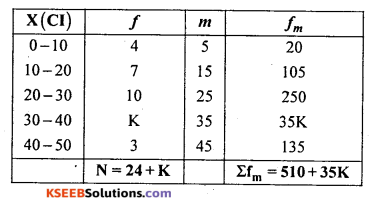
\(\overline{\mathrm{X}}=\frac{\sum f_{m}}{\mathrm{N}}\)
24 = \(\frac{510+35 K}{24+K}\)
24(24 + K) = 5 10 + 35K
576 + 24K = 5 10 + 35K
24K – 35K = 510 – 576
-11K = -66
K = \(\frac{66}{11} \) =6
∴ Missing frequency = K = 6
Question 15.
Find the missing frequency if x̄ = 15.587
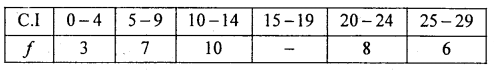
Solution:
Let K be the missing frequency
\(\overline{\mathrm{X}}=\frac{\sum f_{m}}{\mathrm{N}}\)
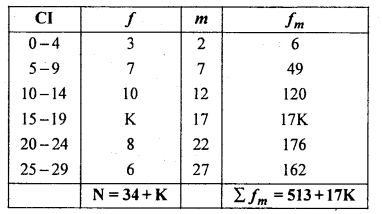
\(\overline{\mathrm{X}}=\frac{\sum f_{m}}{\mathrm{N}}\)
15.587 = \(\frac{513+17 K}{34+K}\)
15.587(34 + K) =+ 17K
529.958 + 15.587K = 513 + 17K
15.587K – 17K = 513 – 529.958
-1.413K = -16.958
16.958
K = \(\frac{16.587}{1.413} \) = 12
∴ Missing frequencyK= 12.
Question 16.
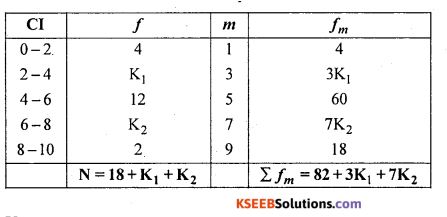
Find the missing frequencies from the following data.
Solution:
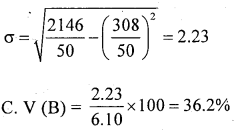
Given that N = 200 and x̄ = 83.875
Let K1 and K2 be the missing frequencies
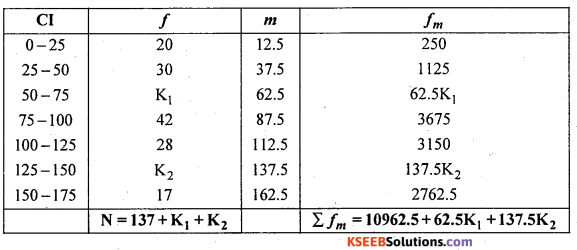
\(\overline{\mathrm{X}}=\frac{\sum f_{m}}{\mathrm{N}}\)
Given = N = 200
![]()
83.875 × 200 = 10962.5 + 62.5K1 + 137.5K2
62.5K1 + 137.5K2 = 16775 – 10962.5
62.5K1 + 137.5K2 = 5812.5 …………..(1)
It is given that M = 200
i.e., 137 + K1 +K2= 200
K1 + K2 = 63…………….(2)
From (1) and (2): (1)-(2) x 62.5
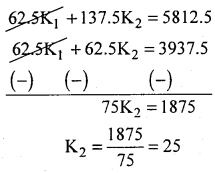
Put K2 = 25 in (1)
K1 + 25 = 63
K1= 63 – 25 =38
∴ K1 = 38, K2 = 25 are the missing frequencies.
![]()
Question 17.
Find missing frequencies if x̄ = 4.8286
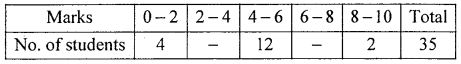
Solution:
Let K1 and K2 be the missing frequencies
\(\overline{\mathrm{X}}=\frac{\sum f_{m}}{\mathrm{N}}\),Given N = 35
4.8286 = \(\frac{82+3 K_{1}+7 K_{2}}{35}\)
169 = 82 + 3K1 + 7K2
3K1 + 7K2 = 87 ……….. (1)
And given : N = 35
i. e, 18 + K1 + K2 = 35
K1 + K2 = 17
From equations (1) and (2)
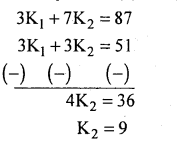
Put K2 = 13 in(l) : K1 + 9 = 17
K1 = 8
∴ K1 = 8, K2 = 9 are missing frequencies.
Question 18.
Find the missing frequency if the median M = 14.75
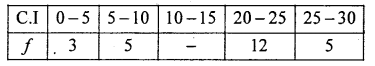
Solution:
Let K be the missing frequency
| Cl | f | LCF |
| 0 – 5 | 3 | 3 |
| 5 – 10 | 5 | 8 |
| 10-15 | – | 8+K |
| 20-25 | 12 | 20+K |
| 25-30 | 5 | 25+K |
| N = 25+K + K |
Since M= 14.75
∴ Median class =10 – 15
2 × 4.75K = (9 + K)J
9.5K = 45 + 5K
9.5K- 5K= 45
4.5K = 45
∴ K=10
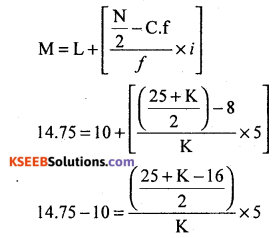
Question 19.
Calculate the missing frequency if median M = 10.3
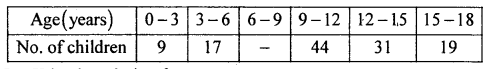
Solution:
Let K be the missing frequency
Since median M = 10.3
∴ Median class = 9 – 12
19.0667 x 2 = 68 – K
K = 68 – 38.1334
∴ K = 29.8664 ≅ 30
Geometric mean and harmonic mean
![]()
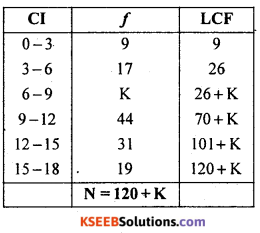
Question 20.
Find the G.M (i) 4.9 (ii) 8.27.64
Solution:
Question 21.
Calculate GM for the following data: 23,450,180,42.5, 2.7,38.2,3.58,0.20
Solution:
Using logarithmic method : G.M = AL\(\frac{\sum \log X}{n}\)
| X | logX |
| 23 | 1.3617 |
| 450 | 2.6532 |
| 180 | 2.2553 |
| 42.5 | 1.6284 |
| 2.7 | 1.4314 |
| 38.2 | 1.5821 |
| 3.58 | 0.5539 |
| 0.20 | -1.3010 |
| n = 8. | 9.7670 |
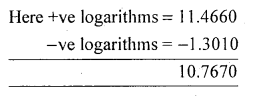
Add mantissa part and subtract the characteristic part
GM = AL\(\frac{10.7670}{8}\) = AL[1.3459] = 22.1768
Question 22.
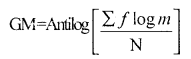
Calculate M for the following frequency distribution of diameter of P.V.C pipes supplied to a Agrahara Municipality.
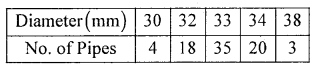
Solution:
(Discrete data)
Let X and f be the diameter (mm) and number of pipes
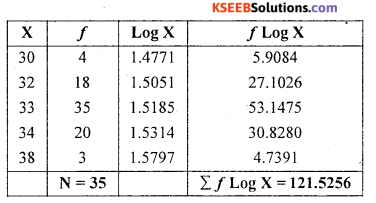
GM = \(\frac{121.5286}{80}\) = Antilog[1.5191]
G.M = 33.04227
Question 23.
Calculate Geometric Mean:
Solution:
GM = AL(1.1602)
GM = 14.4617
Question 24.
Calculate the GM from the following data
Solution:
(continuous data)
m = midpoint
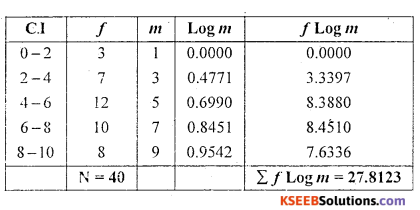
GM = Antilog {\(\frac{27.8123}{40}\)} = Antilog [0.6953]
GM = 4.958
![]()
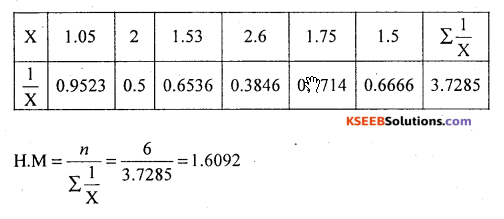
Question 25.
Calculate harmonic mean of 1.05,2,1.53,2.6,1.75,1.5
Solution:

Question 26.
Calculate H.M from the following data : 4, 6, 8, 10, 12
Solution:
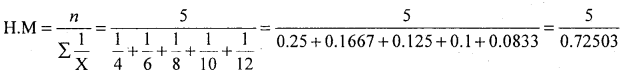
H.M = 6.8962
Question 27.
Find Harmonic for the following frequency distribution
Solution:
(Discrete data)
H.M = 5.0386
Question 28.
Calculate the harmonic mean for the following data
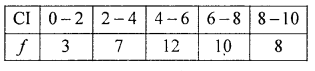
Solution:
(Continuous data)
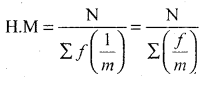
H.M = 16.8123
Question 29.
A man travels at a speed of 20kms per hour to reach a destination and return at a speed of 16 kms per hour. Find his average speed
Solution:
HM = \(\frac{2}{0.1125}\) = 17.77 kms/hour 0.1125
Question 30.
Using the following data show that AM >GM>HM 3,4,5,6,7.
Solution:
AM = \(\frac{\Sigma \mathrm{X}}{n}=\frac{25}{5}\) = 5
GM = Antilog \(\frac{\sum \log X}{n}\) = \(\frac{3.4014}{5}\)
GM=Antilog {0.6803} =4.7894
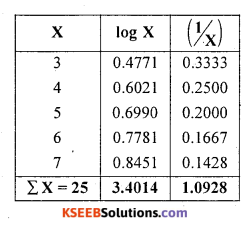
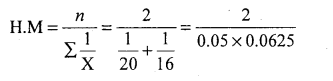
HM = \(\mathrm{HM}=\frac{n}{\Sigma\left(\frac{1}{\mathrm{X}}\right)}\)
HM = \(\frac{5}{1.0928} \) = 4.5754
Here.AM 5; GM = 4.7894 and ¡-1M 4.5754
∴ AM > GM > HM
![]()
Measures of dispersion
Question 1.
What is DiapcrskrníVnrlalion?
Solution:
The deviation/variation of actual salues fions any measure of central tendency is Dispersion/ Variation. The degree/the extent of deviation is the measure ofdispe&on. The tneaswes of dispersion are Range, Quartile deviation, Mean Deviation and the Standard deviation
Question 2.
What are Ahsotntr and Relative measure otdhpersšoits?
Solution:
An absolute measure ofdispersion is a measure which measures ofdispersion of the given data and are expressed in their respective units of measurements.
The relative measure ofdispcrsion is used for the comparison ofdispersion ofdifferent data. which is a pure ratio. which does not contain any units of measurements. They are called coefficient.
Question 3.
Mention the desired qualities of a good measure of dispersion.
Solution:
- It is rigidly defined
- It is based on all salues ofthe dala
- It should not bc affected by the extreme alues of the data
- It should have the sampling stability
- It should be capable of further statistical analysis
Question 4.
Give different measure of dispersion.
Solution:
The measures of dispersion are [a] Range, [b] Quartile deviation, [c] Mean Deviation and [d] The Standard deviation
Question 5.
Define Range and its relative measure with their respective formula and give its Demerits Sol.- Range is defined as the difference between the highest value [H] and the smallest value [s] of the data ie. R=[H-S] is an absolute measure,
The relative measure of. Range is: Co-efficient Range = \(\frac{\mathrm{H}-\mathrm{S}}{\mathrm{H}+\mathrm{S}}\)
Its demerit is that, it is not based on all values and it is affected by extreme values.
Question 6.
Define Quartile deviation and relative measure with their respective formula and give its demerits.
Solution:
Quartile deviation is also called as Semi inter-Quartile Range, ie. Half of the difference between the upper [Q3] and lower [Q1]
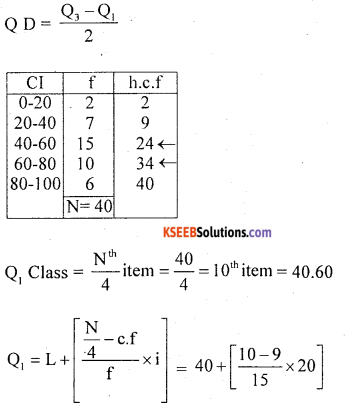
quartile.i.e QD = \(\frac{\mathrm{Q}_{3}-\mathrm{Q}_{1}}{2}\) is an absolute measure.
The relative measure of QD is- Co-efficient of QD = \(\frac{\mathrm{Q}_{3}-\mathrm{Q}_{1}}{\mathrm{Q}_{3}+\mathrm{Q}_{1}}\)
Its demerit is that, it is not based on all values and it ¡s affected by extreme values.
Question 7.
Define Standard deviation and relative measure with their respective formula.
Solution:
Mean deviation is defined as the ‘arithmetic mean of absalute deviations obtained from any mean’ ¡e. \(\mathrm{MD}=\frac{\sum|\mathrm{x}-\overline{\mathrm{x}}|}{\mathrm{n}}\), is an absolute measure
Here the deviation may be taken from mean [x] , med ian[M], mode [Z]. The relative measure
\(\mathrm{MD}=\frac{\sum|\mathrm{x}-\overline{\mathrm{x}}|}{\mathrm{n}}\) is an absolute measure.
Here the deviation may be taken from mean [x̄], median[M], mode [Z]. The relative measure of Mean deviation is- CMD \(\frac{M D[\bar{x}]}{\bar{x}}\) ; similarly for M, and Z.
Its demerit is that, mathematically it suffers from ignoring the algebraic signs. And it gives different results for different measures, hence it is not an accurate method.
Question 8.
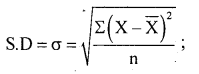
Define Standard deviation and relative measure with their respective formula.
Solution:
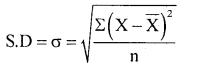
Standard deviation is defined as ‘the square root of the arithmetic mean of the Squares of the deviations obtained from the mean’ OR ‘it is root mean squared Deviations obtained from mean’ Denoted by
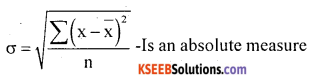
The relative measure of SD is-
The co-efficient of standard deviation is- C.S.D = \(\stackrel{\sigma}{\overline{\mathbf{x}}}\)
Question 9.
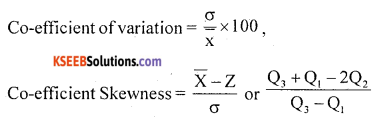
What is a Co-efficient variation/Give the formula of C.V?
Solution:
For better comparison if C.S.D. is expressed in percentages it is called Co-efficient of coefficient
of variation ie., co-efficient variation [c.v] = \(\stackrel{\sigma}{\overline{\mathbf{x}}}\) × 100
Question 10.
Which is the measure of dispersion is used to compare variability of two or more distributions?
Solution:
To compare the variability/dispersion of two or more distributions, co-efficient variation is used
Question 11.
What is meant by Skewness?
Solution:
Lack of symmetry or asymmetrical distribution is called Skewness.
Question 12.
What are the different measures of Skewness?
Solution:
![]()
Question 13.
Define Positive and negative Skewness.
Solution:
When the frequency distribution is plotted on a graph, if the right tail of the curve is Elongated or longer than the left tail, the distribution is called Positively skewed. Where as if the left tail of the curve is elongated or longer than the right tail, the distribution is called Negatively skewed.
Question 14.
Write any two difference between the variation and Skewness.
Solution:
Variation is the dispersion/scatteredness of the actual values from any mean, Where as the Skewness is the spread of the frequencies around the centre or not.
Question 15.
What is a symmetric curve?
Solution:
In a frequency distribution if the frequencies are concentrated around the centre, and the curve is non-skew ie look like bell shaped curve and the Mean, Median and Mode are equal/coincide in the curve and two quartiles Q1and Q3 }are equidistant from the median, then the curve is called symmetric curve.
Question 16.
Write any two properties of positive and negative Skewness.
In Positive Skewness the right tail of the curve is longer than the left tail and here x̄ > Z, in Negative Skewness the left tail of the curve is longer than the right tail and x̄ < Z
Question 17.
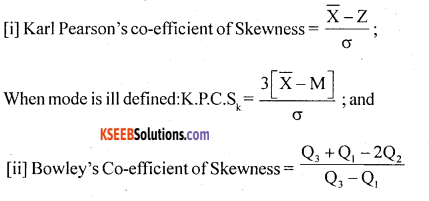
Give the formula of Karl Pearson’s co-efficient of Skewness.
Solution:
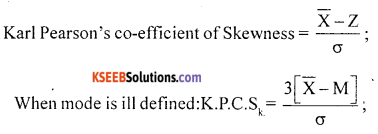
Question 18.
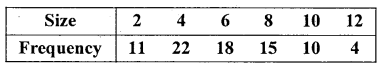
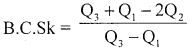
Give the formula of Bowley’s co-efficient of Skewness.
Solution:
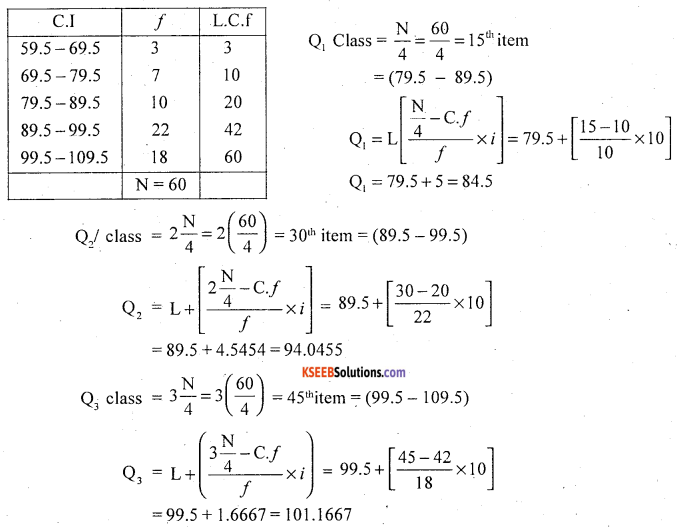
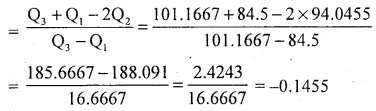
Bowley’s Co-efficient of Skewness = \(\frac{\mathrm{Q}_{3}+\mathrm{Q}_{1}-2 \mathrm{Q}_{2}}{\mathrm{Q}_{3}-\mathrm{Q}_{1}}\)
Question 19.
Define the term “kurtosis”
Solution:
Kurtosis means peaked-ness or steepness of frequency curve as compared to symmetrical curve.
Question 20.
Mention different types of kurtosis.
Solution:
Kurtosis may be Mesokurtic, Leptokurtic and Platykurtic.
Question 21.
Define different types of kurtosis
Solution:
A distribution when its frequency curve is as Normal/Symmetrical curve ie as peaked as Normal curve it is called Mesokurtic.
A distribution which is more peaked than Normal distribution is called Leptokurtic distribution.
A distribution which is less peaked than Normal distribution is called Platykurtic distribution
![]()
Question 22.
Give the values of co-efficient of kurtosis of different of kurtosis
Solution:
For a Mesokurtic distribution β2 = 3,
For a Leptokurtic distribution β2 > 3,
For a Platycurtic distribution β2 < 3.
Problems
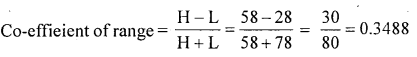
Question 1.
Find Range it’s co-efficient of range for the following data 351,28,40,58,42,50
Solution:
Highest value (H) = 58
LowestValue(L)=28
∴ Range = H – L = 58 – 28 = 30
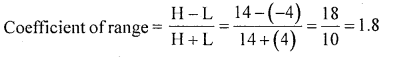
Question 2.
If the highest temperature at North pole region is 14°C and -4°C. Find Range and its coefficient.
Solution:
H = 14;L = -4
Range H-L = 14 – (- 4) = 18°C
Quartile deviation :
Question 3.
Calculate inter quartile range and semi-inter quartile (Q. D) for the following data. 10,15,8,5,16,25,20,15,18,22,16
Solution:
n = 11
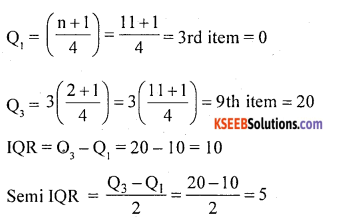
IQR = O3 – Q,and Semi IQR = \(\frac{\mathrm{Q}_{3}-\mathrm{Q}_{1}}{\mathrm{Q}_{3}+\mathrm{Q}_{1}}\)
Arrange in ascending order :
5,8,10,15,15, 16, 16, 18,20,22,25
![]()
Question 4.
Calculate coefficient of Quartile deviation for the following data:
Solution:
Question 5.
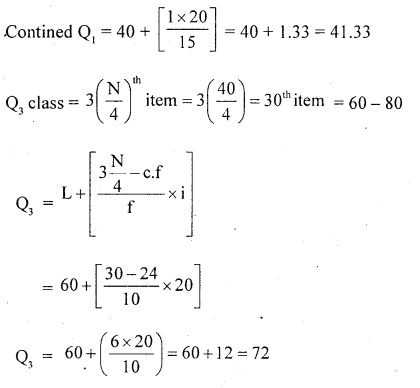
Calculate Quartile deviation for the following data:
Solution:
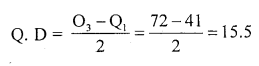
\(\mathrm{Q} \mathrm{D}=\frac{\mathrm{Q}_{3}-\mathrm{Q}_{1}}{2}\)
Question 6.
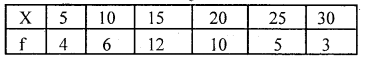
Find semi – inter quartile range for the following distribution.

Solution:
Convert less than cumcelative frequency distribution into simple (le) apper limits and h.c.fare given)
Semi mIQR = \(\mathrm{Q} \mathrm{D}=\frac{\mathrm{Q}_{3}-\mathrm{Q}_{1}}{2}\)
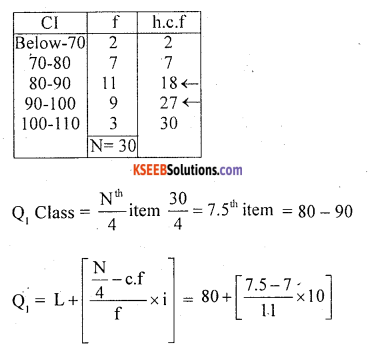
Q1 = 80 + 0.4545
Q1 = 80.4545
Questi0n 7.
Calculate Q.D and its relative measure for the following distribution.’
Solution:
Convert inclusive class interuals into exclusive C.I
Here corrcction factor: CF = \(\frac{\mathrm{LLII}-\mathrm{UII}}{2}=\frac{20-19}{2}=1 / 2=0.5\)
![]()
Questi0n 8.
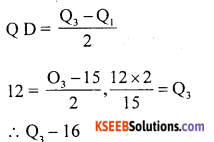
The sum of lower and upper Quartiles of a set of datais 90 and their difference is 12.5. Find QD and its relative measure.
Solution:
Give Q1 + Q1 = Q3 + Q1 = 90 and Q1 – Q1 = 12.5
\(\mathrm{Q.D}-\frac{\mathrm{Q}_{3}-\mathrm{Q}_{1}}{2}=\frac{12.5}{2}=6.25\)
COQ = \(\frac{\mathrm{O}_{3}-\mathrm{Q}_{1}}{\mathrm{O}_{3}+\mathrm{Q}_{1}}=\frac{12.5}{90}\) = 0.1388
Question 9.
If QD=12, Q1 = 15 Find Q3
Solution:
Question 10.
If lower and upper quartiles of a data ave 15 & 60. Find Q. D and its coefficient of Q.D.
Solution:
![]()
Mean Deviation
Question 1.
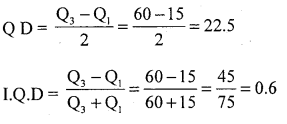
Ca!culate the mean deviation and its relative measure for the following data based on mean.
10,20,50, 70,80
Solution:
Question 2.
Calculate mean deviation from median.
X : 5, 8, 12, 6, 10, 3, 10
Solution;
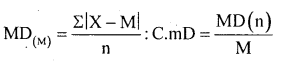
Here median = \(\left(\frac{n+1}{2}\right)^{t h}\) n= 7
Arrange the ascending order
\(\left(\frac{7+1}{2}\right)\) = 4th ltem
∴ M = 8
M.D = \(\frac{8}{7}\)= 1.1428
C.M.D= \(\frac{1.1428}{8}\) = 01428
Question 3.
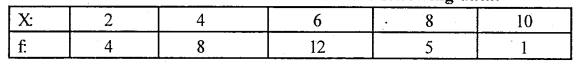
Calculate mean deviation from made for the following data.
10, 12, 15, 18,20, 15, 16, 13, 15
Solution:
Here made (Z) = Size of (lie most repeated item’
Z=15; n=9
Σ |X – Z| = 19
MD(z) = \(\frac { 19 }{ 9 }\) = 2.11
C.M.D =\(\frac { 2.11 }{ 15 }\) = 0.1406
Note : In practice means deviation will be calculated form median.
![]()
Question 4.
Calculate mean deviation from mean from the following data:
solution:
Note : In practice mean deviation will be calculated from median.
Question 5.
Calculate mean deviation from mean from the following data:
Solution:
Question 6.
Calculate mean deviation from median and also compute its relative Metascore.
Solution:
![]()
Question 7.
Compute mean deviation from made and its coefficient from the following data.
Here Z (mode) = Size of highest frequency
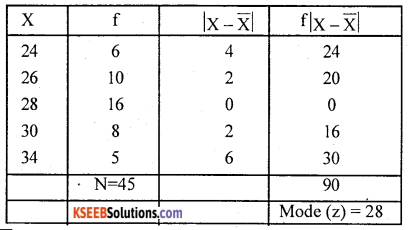
MD(z) = \(\frac { 90 }{ 45 }\) = 2 inches
C.M.D = \(\frac { 2 }{ 28 }\) = 0.0714
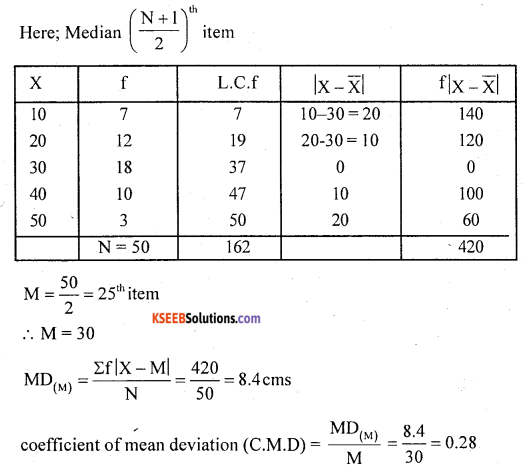
Question 8.
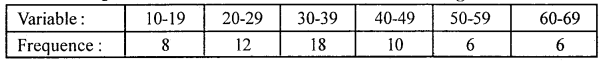
Find mean deviation and the coefficient of mean deviation from mean for the following frequency distribution.
Solution:
x̄ = \(\frac { 1540 }{ 60 }\) = 25.67
M.D = \(\frac { 568.04 }{ 60 }\) = 9.4673
C.M.D = \(\frac { 9.467 }{ 25.67 }\) = 0.3688
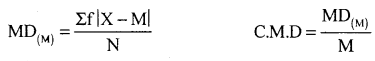
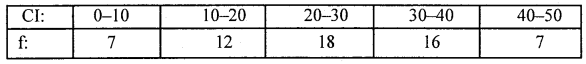
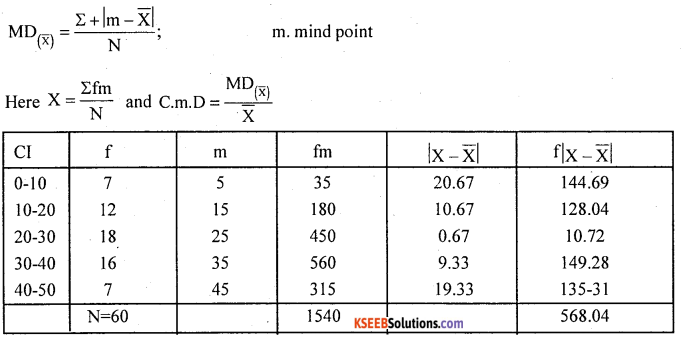
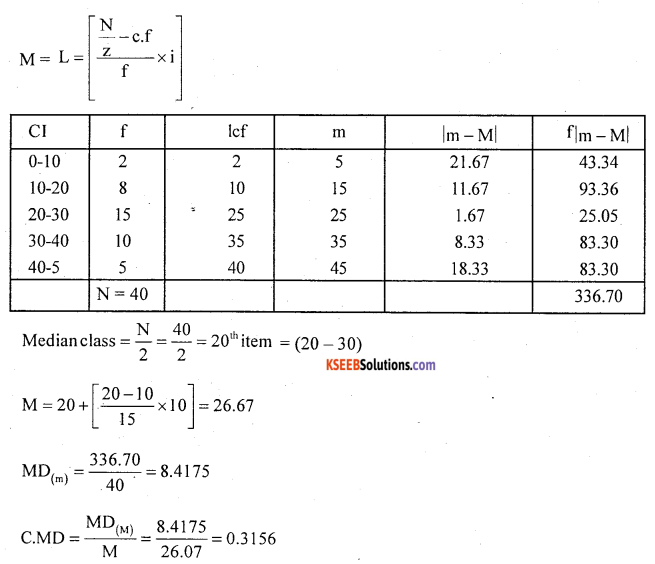
Question 9.
Compute mean deviation from median and its relative measure from the following data.

Convert into simple frequency distribution
Here m – mind point
CMD = \(\frac{\mathrm{MD}_{(\mathrm{M})}}{\mathrm{M}}\)
Median class = \(\frac{\mathrm{N}^{\mathrm{th}}}{\mathrm{z}}\) Item
![]()
Standard deviation
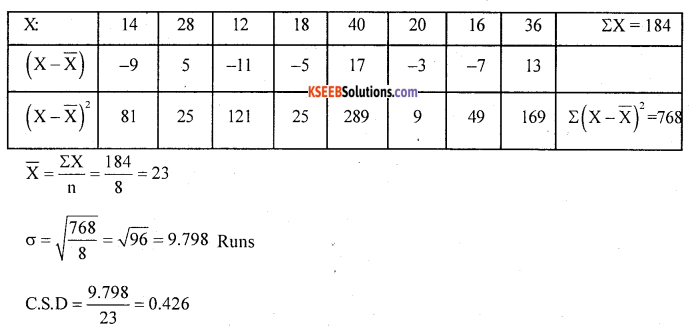
Question 10.
Calulate S.D and the coefficient of S.D from following runs scored by a batsmen in 8 test matches.
Solution:
Runs: 14,28, 12, 18,40,20, 16,36
Here \(\overline{\mathrm{X}}=\frac{\Sigma \mathrm{X}}{\mathrm{n}} \)
Coefficient of standand deviation:
CSD = \frac{\sigma}{\bar{x}} , n = 8
Question 11.
Following is the data regarding the temperature recorded over a week in summer at a certain town. Compute standard deviation and its variance.
Solution:
Temp (in °C): 34,40,36,35,37,38,39
Here \(\overline{\mathrm{X}}=\frac{\Sigma \mathrm{X}}{\mathrm{n}} \)
Variance=σ2 , n= 7
\(\bar{X}=\frac{259}{7}\) = 37
σ = \(\sqrt{\frac{28}{7}}\) 2°C
Variance=σ2 = 22=4°C2
Note : Use actual mean method only when mean’s a integer.
Question 12.
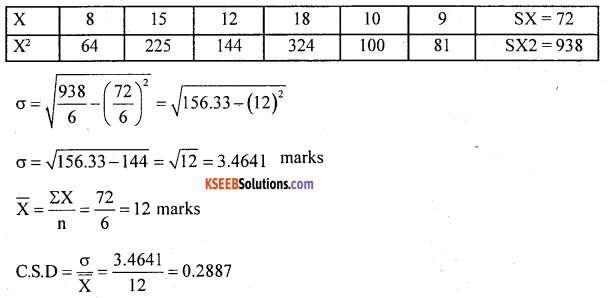
The following are marks scored by six students in a test. Find S.D and its relative measure marks : 8,15,12,18,10, 9.
Solution:
(Data is small size use direct method, Actual mean methed can also be used)

Coefficient = S.D = \(\frac{\sigma}{\bar{X}}\)
\(\overline{\mathrm{X}}=\frac{\Sigma \mathrm{X}}{\mathrm{n}} \)
Question 13.
Following is the data regarding the number accidents occurring in a month. Compute standard deviation graidents.
Solution:
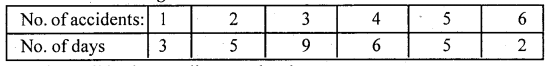
Data is small in size use direct methead
![]()
Question 14.
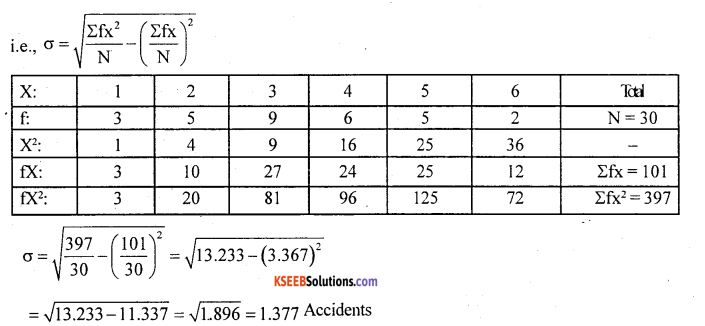
Calculate S.D for the following data using deviation method :
15,24,18,30,28,25.
Answer:
UsingAssumed mean method:
Question 15.
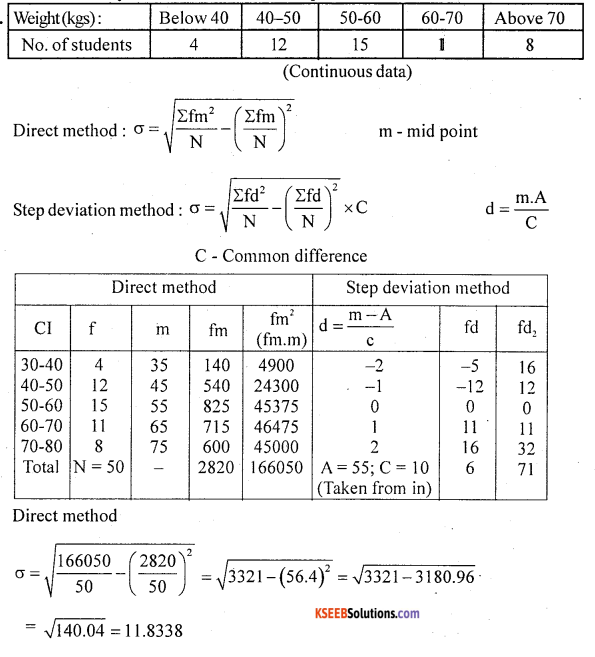
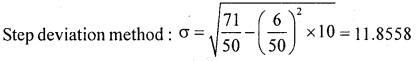
Calculate the S.D for the following frequency distribution regarding weights (in kgs) of students by direct method and step deviation method.
Solution:
Question 16.
Calculate S.D and the variane

Solution:
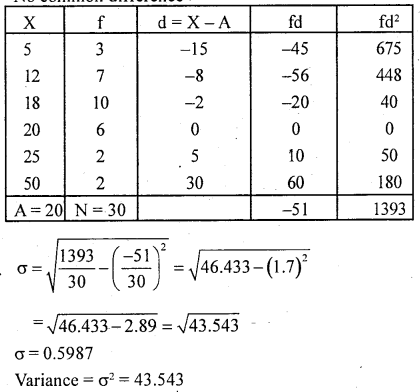
(discrete data)
No common difference.
Question 17.
The following gives the runs made by two Batsnian A and B in 8 innings.
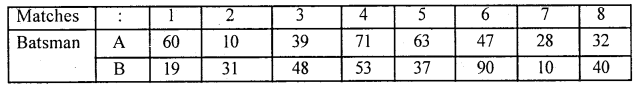
Solution:
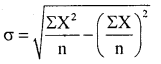
Raw data : Compute C.V for Batsman A and B: CV \(=\frac{\sigma}{\bar{X}} \times 100\);
\(\overline{\mathrm{x}}=\frac{\Sigma \mathrm{x}}{\mathrm{n}}\)
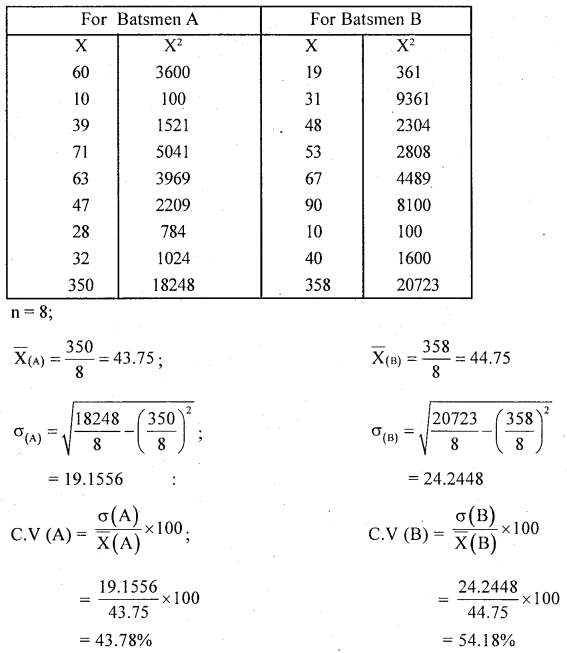
Here C.V (A) < C.V (B)
.’. Batsmen A is more consistent and uniform in scoring runs than batsmen B.
Question 18.
Lives of CFL bulbs of two medels are given below :
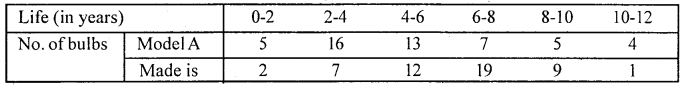
Which of madel bulbs have more life on an average which madel is more consistent?
Solution:
Compute coefficient of variation (C. V) for two madels seperately.
C. V = \(\frac{\sigma}{\overline{\mathrm{x}}} \times 100\)
m = mid point
For madel A
Here fm2 = fm.m
For Model B
Conclusion : Here x̄B > x̄A
∴model A bulbs are better life in an average And C.V (A) < C.V (B)
∴Madel B bulbs are more consistentin in life.
![]()
Question 19.
Calculate combined standard deviation from the following data:
n1 = 30, n2 = 50 x̄ = 23 x̄2 = 45 ; σ1= 8, σ2= 12
Solution:
First compute combined mean
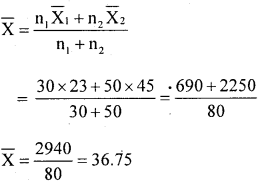
The combined standand deviation:
Here d12 = (x̄1 – x̄)2 = (23-36.75)2 = 189.06
and d22 = (x̄2 -x̄)2 = (45-36.75)2 = 68.06
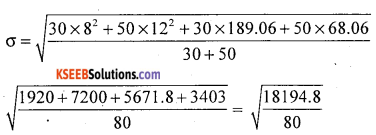
σ = 15.08
Question 20.
The mean and standard deviation of montly salary of factory employees of A and B are as given below :
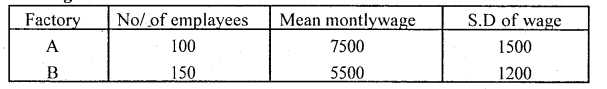
(i) Which factory pay more wages to the employees / greater wage bill?
(ii) Which factory wages is more uniform in wages.
(iii) Find combined /pooled S.D
Answer:
Given: n1= 100 ; n2=150
x̄1 =7500 x̄2 = 5500
σ1 = 1500 σ2 = 1200
(i) Total wages of employees of factory A = n1x̄1 = 100 × 7500 = ₹ 750000
Total wages of employees of factory B = n1x̄2 = 150 × 5500 = ₹ 825000
From the above factory B’s wage bill is more than factory A.
(ii) C.V (A) = \(\frac{\sigma_{1}}{\overline{\mathrm{X}}_{1}}\) × 100 = \(\frac{1500}{7500}\) × 100 = 20%
CV(B) = \(\frac{\sigma_{2}}{\overline{\mathrm{X}}_{2}}\) × 100 = \(\frac{1200}{5500}\) × 100 = 21.82%
C.V (A) < CV (B)
Factory A’s wages are more uniform and consistent
(iii)
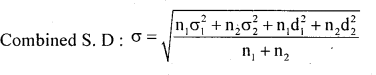
Here x̄ combined mean
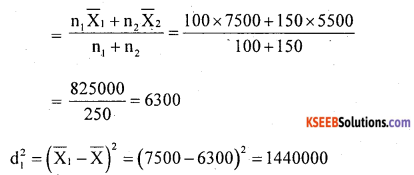
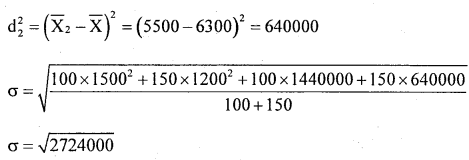
σ = 1650.45 is the combined S.D of wages.
Question 21.
If mean and S.D of a distribution are 50 and 15 respectively. Find the coefficient of variation.
Answer:
C.V = \(\frac{\sigma}{\bar{X}} \times 100=\frac{15}{50} \times 100\) = 30%
![]()
Question 22.
If mean and C.V of a data are 30 and 18% respectively. Find S.D.
Answer:
C.V = \(\frac{6}{\bar{X}} \times 100\)
15 = \(\frac{\sigma}{30} \times 100\)
\(\frac{18 \times 30}{100}\) = σ
∴ σ = 5.4
Question 23.
If C. V and S. D of a data are 35% and 15. Find the mean.
Answer:
C.V = \(\frac{\sigma}{\mathrm{X}}\) × 100
35 = \(\frac{5}{35}[latex]\) × 100
x̄ = \(\frac{5}{35}\) × 100
x̄ = 42.86
Skewness and Kurtosis
Question 1.
Calculate Karl Pearson’s coefficient of skewness from the following data.
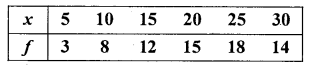
Solution:
Discrete data:
K.RC.Sk = \(=\frac{\bar{x}-z}{\sigma}\)
Here mean x =\(\bar{x}=\frac{\Sigma f x}{\mathrm{N}}\)
Here fx2 = fx . x
\(\bar{x}=\frac{\Sigma f x}{\mathrm{N}}=\frac{1445}{70}\)
x̄ = 20.6428
z = Heighest frequency is 18, its size is 25
∴ z = 25
Karl pearson’s coefficient of skewness
= \(\frac{x-z}{\sigma}=\frac{20.6428-25}{7.1675}\)
K.P.C.SK = 0.6078
There exists a high degree positive skewness.
Note: Observe that there are more frquecies at the end of the distribution. So skewness is + ve
![]()
Question 2.
Calculate Bowley’s coefficient of skewness:
Solution:
Discrete data:
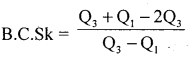
Here, quartiles can be calculated:
After calculating less than cumulative frquency (L.C.f)
Qj class = size of \(j\left(\frac{N+1}{4}\right)^{t h}\) item ; j = 1, 2, 3
The distribution is non-skew i.e., symmetrical.
Question 3.
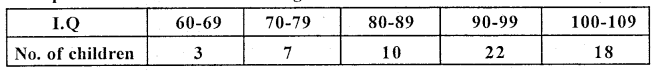
From the following frequency distribution compute karl pearsons coefficient of skewness
Solution:
K.P.C.Sk = \(\frac{\bar{x}-z}{\sigma}\)
Here, for continuous data use:
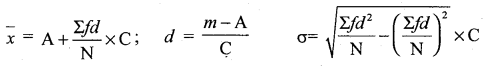
Modal class = size of highest frequency.
Modal class = 10-20
There exists high degree + ve skewness
Question 4.
Calculate Bowicy’s coefficient of skewness from the following
Solution:
To compute quartiles, Qjclass = \(\frac{N^{\text {th }}}{4}\) item
Bowley’s coefficient of skewness :
The distribution is positively skewed.
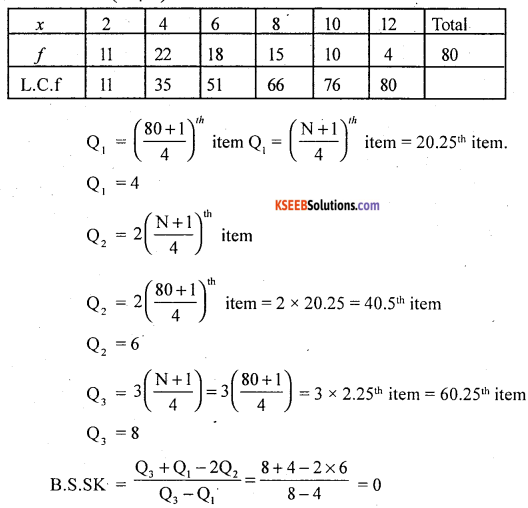
Question 5.
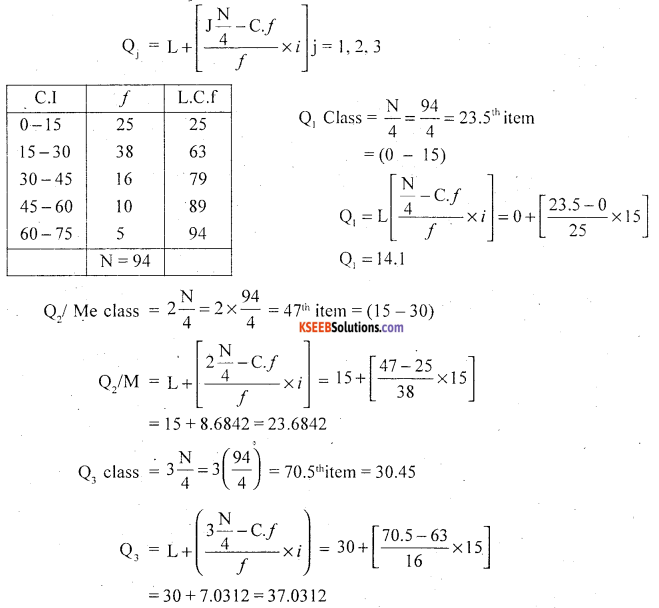
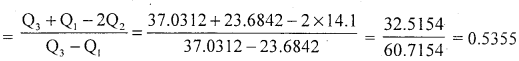
Compute B.C.Sk from the following data
Solution:
Convert inclusive class intervals into exclusive class intervals. Using the correction factor: LL II class – ULI class
\(\frac{\text { LL II class -ULI class }}{2}\)
CF = \(\frac{70-69}{2}\) = 0.5
Subtract CF in all lower limits and add to all upper limits, we get,
Bowley’s coefficient of skewness :
The distribution is positively skewness.
![]()
Question 6.
Compute the coefficient of skewness based on Pearson’s method.

Solution:
In the above frequency distribution, the frequencies are asymmetrical. So, to find skewness use:
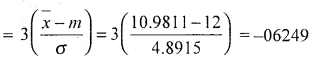
K.P.C.S = 3 \(\left(\frac{x-m}{\sigma}\right)\)
Here x̄ = \(\frac{\Sigma f x}{N}\)
Median after finding less than cumulative frequency (L.C.F)
M = \(\left(\frac{\mathrm{N}+1}{2}\right)^{\mathrm{th}}\) item; and
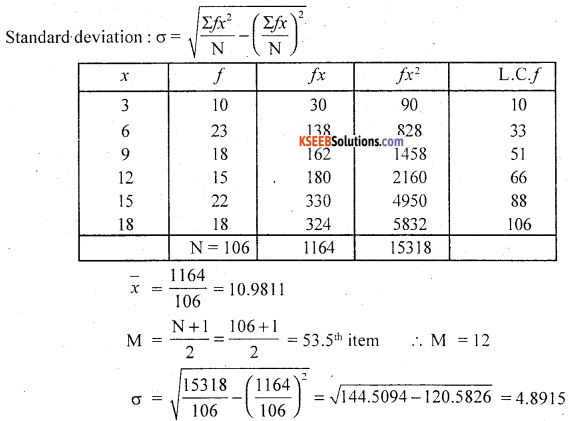
Karl Pearson’s coefficient of skewness:
Note: Same type of problems can also be solved for continuous data.
Question 7.
Find the coefficient of skeness if mean = 50, Made = 53 and S.D = 5.
Solution:
Karl Pearson’s coefficent of skewness = \(\frac{\bar{x}-z}{\sigma}\)
coefficent of slewness = \(\frac{50-.53}{5}\) = 0.6
Question 8.
A frequency distribution given the following results : (i) CV = 5, (ii) SD = 2 (iii) Karl Pearson’s coefficient of skewness = 0.5. Find the mean and the made of the distribution.
Solution:
We know that : C.V = \frac{\sigma}{\bar{x}} × 100
0.5 = \(\frac{50-z}{2}\)
∴ x̄ = \(\frac{2}{5}\) × 100 = 40
K.P.C.Sk = \(\frac{\bar{x}-z}{\sigma}\)
0.5 × 2 = 40 – z
5 = \(\frac{2}{x}\) × 100
∴ z = 40 – 1 =39
Question 9.
For a distribution, Bowley’s coefficient of skewness is -0.56, Q1 = 16 and Q2 = 24. find coefficient of quartile deviation.
Solution:
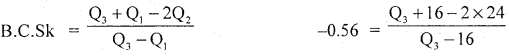
-0.56(Q3 – 16) = Q3 + 16 – 48
-0.56Q3 +8.96 =Q3 – 32
32 + 8.96 = Q3 + 0.56Q3
40.96 = 1.56Q3
∴ Q3 = \(\frac{40.96}{1.56}\) = 26.26
Now, coeffient of quartile deviation = \(\frac{\mathrm{Q}_{3}-\mathrm{Q}_{1}}{\mathrm{Q}_{3}+\mathrm{Q}_{1}}\)
= \(\frac{26.26-16}{26.26+16}\) = \(\frac{10.26}{42.26}\) = 0.24
Question 10.
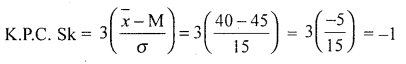
Calcualte K.P.C.Sk if Mean = 40, Median 45 and σ = 15.
Solution:
Question 11.
The mean of a distribution is 25. Its S.D is 8 and the coefficient of skewness is -1. Find the median.
Solution:
K.P.C.Sk = 3 (\(\frac{\bar{x}-\mathrm{M}}{\sigma}\))
-1 =3(\(\frac{28-\mathrm{M}}{8}\))
\(\frac{-8}{3}\) = 25—M
M = 25 + 2.67
M = 27.67
Question 12.
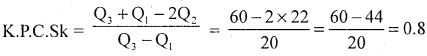
In a distribution, sum of Lower and upper quartiles is 60 and their difference is 20. If the median 22, (Then find then coefficient of skeness.
Solution:
Given Q3 + Q1 = 60 and Q3 – Q1= 20
Median Q2 = 22
Question 13.
In a distribution, if Q1 = 50 and semi-inter quartile range is 15. If the (listribLltiOn is symmetrical, then find Q2.
Solution:
Semi-inter quartile range. Quartile deviation = \(\frac{\mathrm{Q}_{1}-\mathrm{Q}_{1}}{2}\) = 15
Q3 – 50 = 15 × 2
Q3 = 30 + 50 = 80
For a symmetrical distribution, the two quartiles are equidistant from the median:
∴ Q3 – Q2 = Q2 – Q1
2Q2 = Q3 + Q1
Median/Q2 = \(\frac{\mathrm{Q}_{3}+\mathrm{Q}_{1}}{2}=\frac{80+50}{2}\) = 65
Question 14.
What is the relation between Q1, Q2 and Q3 ¡n a positively skewed frequency distribution?
Solution:
For a positively skewed distribution:
(Q2 – Q1) < (Q3 – Q2),
Similarly for a Negatively skewed distribution : (Q2 – Q1) > (Q3 – Q2)
Question 15.
The first four central monientsare, ‘O’, 20, -50 and loo comment of skewness and kurtosis.
Solution:
Given:
µ1= 0
µ2 = 20
µ3 = 50
µ4= 100
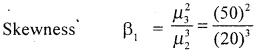
β1 = 0.3129
The distribution is positively skewed.
Kurtosis: β2 = \(\frac{\mu_{4}}{\mu_{2}^{2}}=\frac{100}{20^{2}}=\frac{100}{40}\) = 2.5
Here β2 > 3 the distribution is platykurtic.
Question 16.
If β2 = 1.25. What type of kurtosis the distribution has?
Solution:
Here β3 < 3, the distribution is platykurtic.
![]()
Question 17.
If β2= 3.723. What type of Kurtosis tue distribution lias?
Solution:
Here β2 > 3, the distribution is heptokurtic.
Question 18.
If µ2 = 32.15 and µ4 = 4954 find β2.
Solution:
Kutosis β2 = \(\frac{\mu_{4}}{\mu_{2}^{2}}=\frac{4954}{32.15^{2}}\) = 4.79
Insert at the end of the unit Xl
Unit XI Analysis of Bivariate
Question 1.
Draw a slatter diagram for the following data and commen on correlation.
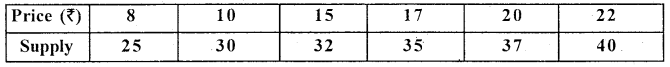
Solution:
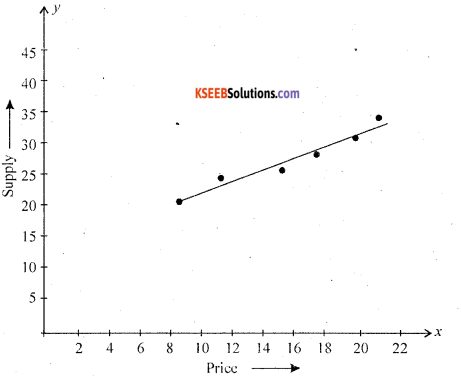
From the diagram, the scatterd points shows raising straightline. There exists a high degree positive correlation between price and supply.
Question 2.
Draw a scatter diagram for the following data and interpret it.
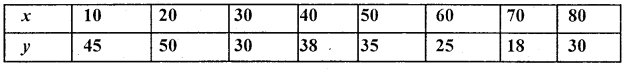
Solution:
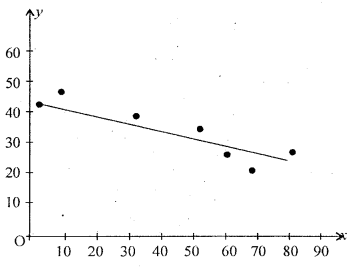
From the scattered diagram, the spraded fo the points show downward diagram. Hence x and y are negatively correlated.
Question 3.
The following data gives the age of a motor cycle and the annual maintenance cost over a period. Find the product moment coefficient of correlation and interpret the same.
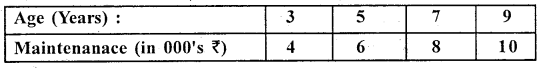
Solution:
Let x andy be the age and maintenance cost, the data is small in size, so use direct method.
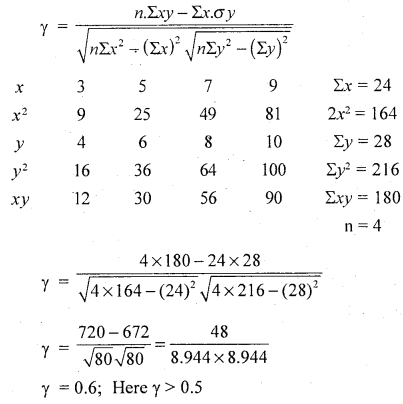
∴ There exists a high degree positive correlation.
Question 4.
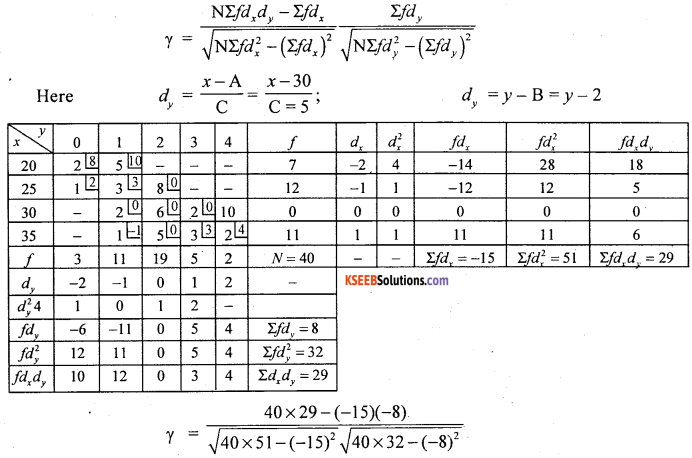
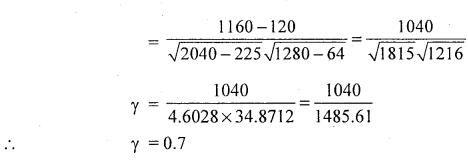
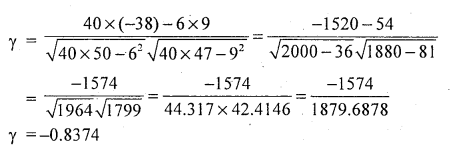
Calculate karl pearson’s coefficient of correlation between .v and y.
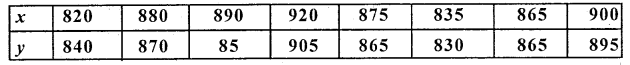
Solution:
The data is large in size, so use step deviation or short cut method.
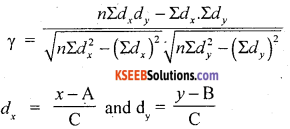
where A, B assumed means and C – common factors from x and y.
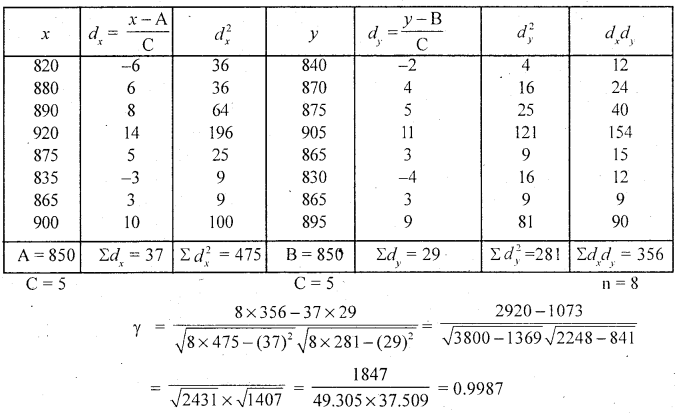
Here γ > 0.5. The exists high degree or close to perfect positive correlation.
![]()
Question 5.
Find K.P.C.S of the following data
![]()
Solution:
Let x and y be ages of husbands and wifes. Here by observation method. Arithmetic means are whole numbers/ integers. 50, it is convenient to use actual mean method.
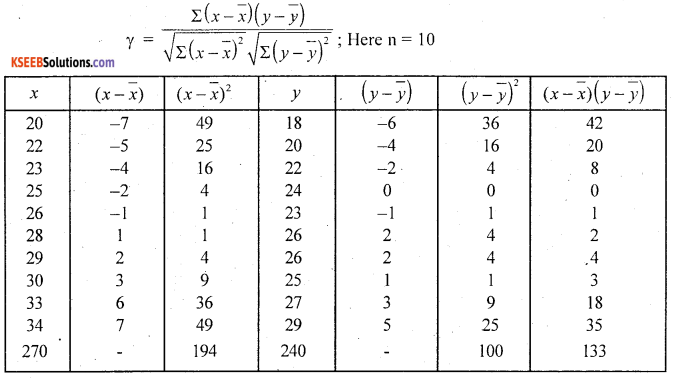
The correlation between ages of husbands and wifes is high degree.
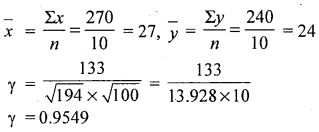
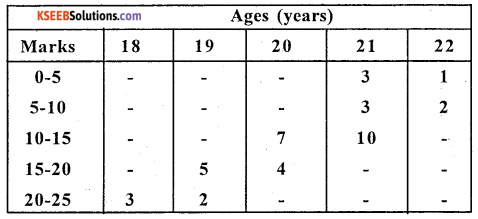
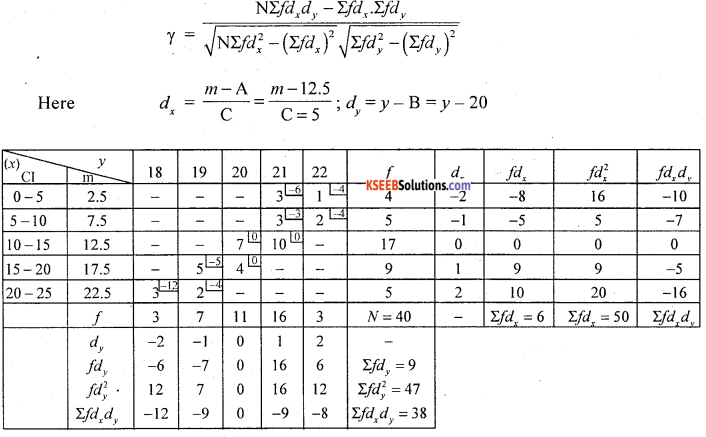
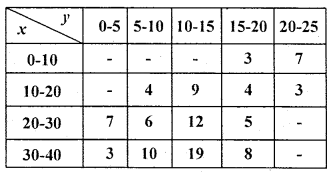
Question 7.
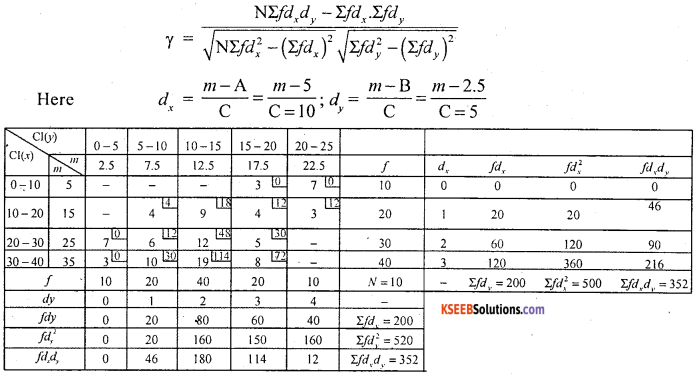
Calculate the coefficient fo correlation between the number of children and age of mothers from the following bivariate frequency table.
Solution:
Let x and y be the ages of mothers and number of children.
The data is discrete nature for ‘y’ and with a common difference in x:
There exists a high degree negative correlation between ages of mothers and number of children.
Question 8.
Calculate the karl pearson’s coefficient of correlation between ages of students and marks obtained in a certain test and interpret.
Solution:
Let x and y be the marks and age
Here, there exists high degree negative correlation between Age of students and their marks.
![]()
Question 9.
Calculate K.P.C.C from the following date.
Solution:
Both variables are continuous so, use step deviation method.
Question 10.
If the covariance between x and y variables is 12.5 and variance of x and y are respectively 16.4 and 13.8. Find the coefficient of correlation between them.
Solution:
We know that:
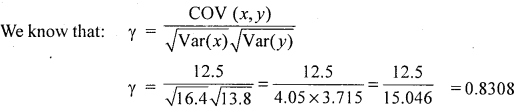
Question 11.
Given COV (x, y) = -30, Var (x) = 225 and Var (y) = 9, find karl pearson’s coefficient of correlation.
Solution:
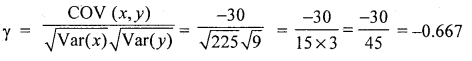
Question 12.
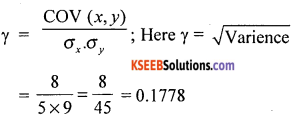
In a bivariate data, if standard deviations of x and y are 5 and 9 respectively. If the COV (x, y) = 8, find the coefficient of correlation.
Solution:
Question 13.
Find the coefficent of correlation:
Solution:
![]()
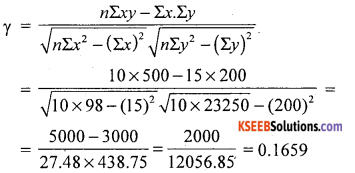
Question14.
In a bivariate data Σxy = 500, Σx = 15, Σy = 200, Σx2 = 98, Σy2 = 23250 and n = 10. Find the coefficient of correlation.
Solution:
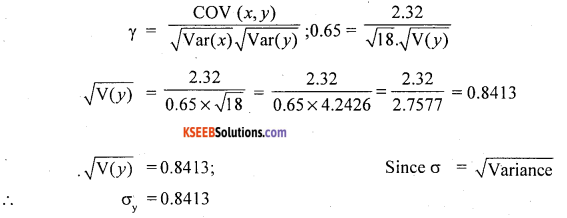
Question 15.
The coefficient of correlation between two variables x and y is 0.65, their covariance is 2.32. The variance of x is 18. Find standard deviation of y.
Solution:
Question 16.
If the coefficient of correlation between x and y is ‘O’ comment.
Solution:
If γ = 0. the two variables x and y are independent, i.e., Non correlated.
Question 17.
Define spurious correlation.
Solution:
Absence of causation between the variables is called spurious correlation.
![]()
Question19.
Calculate spearman’s rank correlation for the following data regarding sports and studies of 8 students:
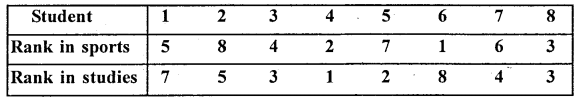
Solution:
Ranks are given. Let R1 and R2 be the ranks in sports and studies.
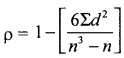
d = R1 – R2, n- No. of observations = 8
There exists low degree negative correlation between sports and studies.
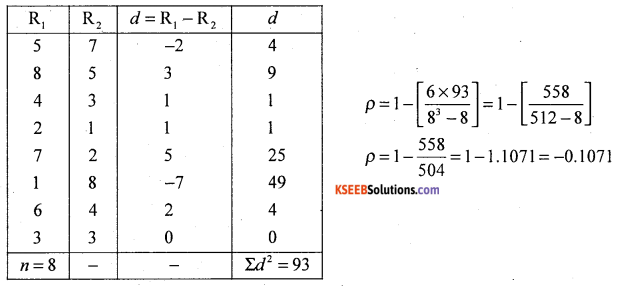
Question 20.
Ten competitors in a pointing competition are ranked by two judges. Using rank correlation find out whether the two judges have common table in painting:
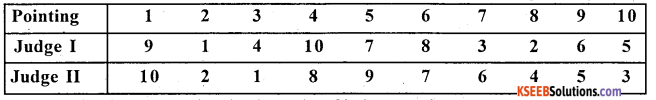
Solution:
Ranks are given. Let R1 and R2 be the ranks of judgcs I and II
Here d=R1 – R2, n = 10
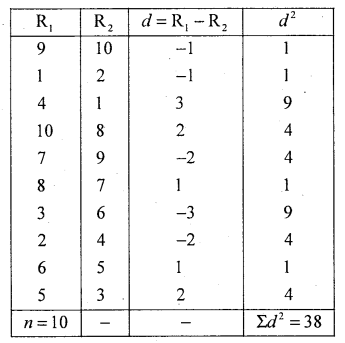
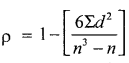
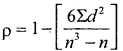
ρ = \(1-\frac{6 \times 38}{10^{3}-10}\)
\(\frac{228}{990}\) = 1 – 0.2303
ρ = 0.7097
the two Judges have high degree of similar taste in beauty of paintings.
![]()
Question 21.
The corresponding values of 2 series are given below.
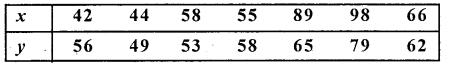
Find the coefficient of rank correlation of the above series.
Solution:
Ranks are not given. We have to assign rank. Assign ranks R1 and R2 for the variables x and y in descending order as highest value as 1, 2, upto 7.
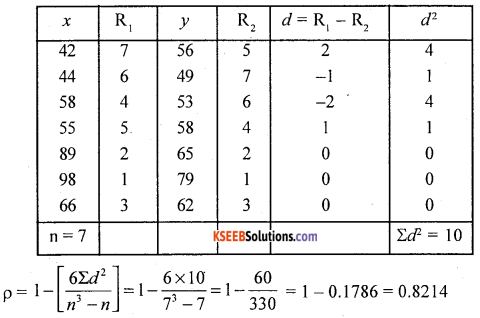
There exists a high degree positive correlation.
Question 22.
Calculate rank correlation from the following marks in Accountancy and statistics.
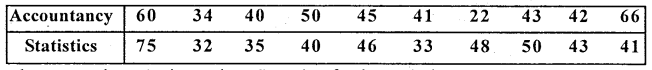
Solution:
Ranks are not given. Assign ranks as R1 and R2 for the marks in Accountancy and statistics as 1st rank who got highest marks and 2nd to next less marks.
d=R1 – R2, n = 10
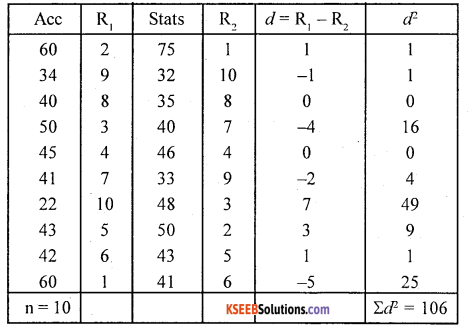
ρ = \(1-\frac{6 \times 106}{10^{3}-10}\) = 1 – 0.6424
∴ ρ = 0.3576
There exists Low degree correlation between marks in Accountancy and Statistics.
Question 23.
Calculate rank correlation coefficient from the following data:
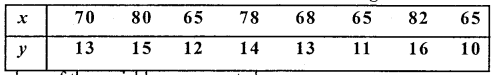
Solution:
Here the values of the variables are repeated.
So use, the formula;
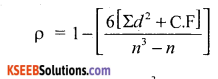
Where correction factor:CF = \(\frac{m^{3}-m}{12}\); m – No. of times the variable repeated.
n = 8; Let R1 and R2 be the ranks of x and y.
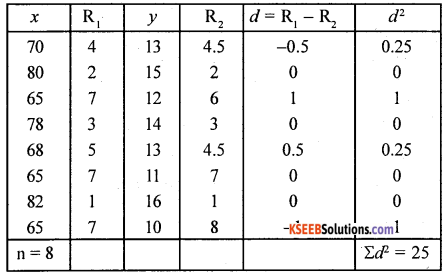
m1 = 3 (65 repeated 3 times)
Ranks are averaged as \(\frac{6+7+8}{3}\)= 7
m2 = 2(13 repeated 2 times)
Ranks are averages as = \(\frac{4+5}{2}\)= 4.5
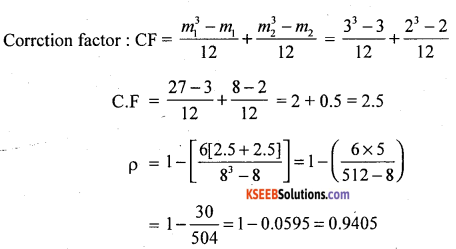
There exists high degree positive correlation between x and y.
![]()