Karnataka State Board Solutions for 2nd PUC Statistics Question Banks with Answers, Solutions, Notes, Guide Pdf are prevailing here in direct pdf links for effective exam preparation. Students who are studying for 2nd PUC Statistics textbook solutions can refer to this page for grabbing KSEEB 2nd PUC Statistics Solutions pdf chapter wise for free. By reading the textbook solutions. You Can Download 2nd PUC Question Bank with Answers from Karnataka State Board solutions, you will be able to understand all the exercises and score good marks.
Also, there are so many advantages that you can avail from the Karnataka State Board Solutions for 2nd PUC Statistics Question Bank with Answers, Solutions pdf. So download 2nd PUC Statistics Notes from KTBS Solutions Pdf via quick links & access them easily while preparation. Students can also read 2nd PUC Statistics Model Question Papers with Answers hope will definitely help for your board exams.

Karnataka 2nd PUC Statistics Question Bank with Answers
Provided Karnataka State Board solutions for 2nd PUC Statistics textbook solutions are prepared by subject experts after ample research. So students are suggested to download the 2nd PUC Statistics Question Bank with Answers and Textbook Solutions from the available PDF links and kickstart your preparations for final exams. You can download them freely & practice regularly to score high marks in the examinations. Access the below Chapter-wise links and learn complete by using 2nd PUC Statistics Question Bank with Answers from Karnataka State Board solutions pdf.
- Chapter 1 Vital Statistics
- Chapter 2 Index Numbers
- Chapter 3 Time Series
- Chapter 4 Interpolation and Extrapolation
- Chapter 5 Theoretical Distribution
- Chapter 6 Statistical Inference
- Chapter 7 Statistical Quality Control
- Chapter 8 Operations Research
Features of 2nd PUC Statistics Question Bank with Answers
- For the first time Pre-University Department has been released the Question Bank for the Second Year PUC Statistics.
- Second Year PUC Statistics Text Book contains 8 units
- The questions in the Question Bank are framed for all the units on the basis of the text book.
- Following is the pattern of the Question Bank.
- Section A – each question carries one mark.
- Section B – each question carries two marks.
- Section C – each question carries five marks.
- Section D – each question carries ten marks.
- Section E – each question carries five marks (Practical – oriented questions).
- Tests, Mid-term and Annual Examination Question Papers should be based on this Question Bank.
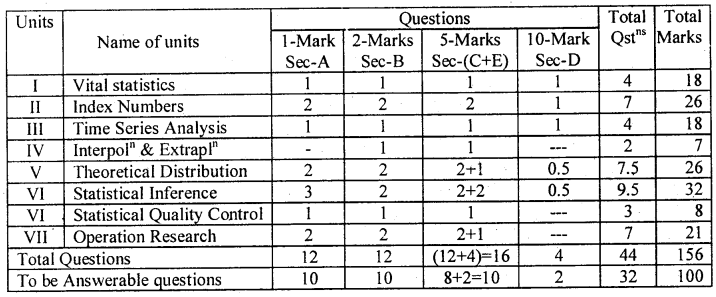
Karnataka 2nd PUC Statistics Syllabus and Marking Scheme
Karnataka 2nd PUC Statistics Blue Print of Model Question Paper
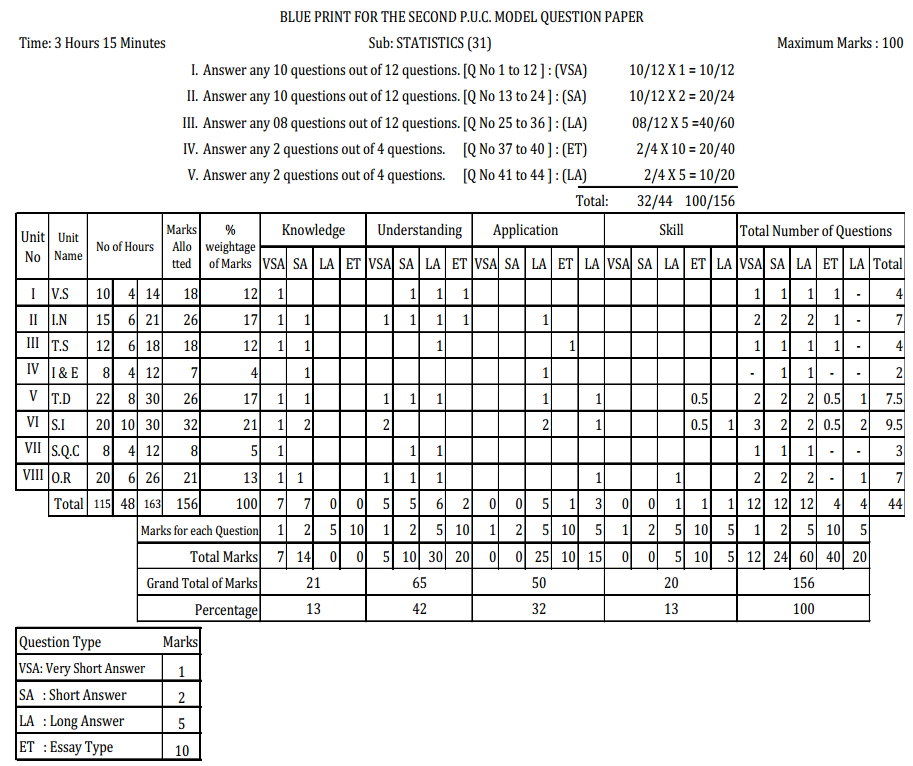
Note:-
* Sec-D: Four 10 Marks question are set as, one each from Units I to III and one from Unit V and VII
* Sec-E: Four 5 marks questions are set as, one question selected either from Unit V, two questions from Unit VI and one question from Unit VII.
Unit I VITAL STATISTICS
Meaning of demography and Vital statistics.
Methods of collection of Vital Statistics-census method and registration method, uses.
Fertility rates: CBR, ASFR, GFR and TFR – definition, merits, demerits and related problems.
Growth rate: GRR and NRR – definition, merits, demerits and computation.
Mortality rates: CDR, ASDR, SDR, IMR, NMR and MMR-definition, merits, demerits and related problems.
Life table: Meaning, uses, components of a life table, 1 and 2 marks problems.
Unit II INDEX NUMBERS
Meaning, characteristics, uses and limitations. Construction of an index number-steps-simple and weighted (AM, GM and aggregative). Price, Quantity and Value index numbers. Price and quantity index numbers-Laspeyre’s, Paasche’s, Marshall-Edge worth’s, Dorbish- Bowley’s and Fisher’s. Kelly’s price index number. Bias in an index number.
Consistency tests: TRT and FRT- description, verification, Unit and Circular Tests (statements and explanation only). Fisher’s index number is ideal-reasons.
Consumer price index numbers: Meaning and uses, construction: Aggregative expenditure method and family budget method, problems.
Unit III TIME SERIES ANALYSIS
Meaning, example, uses. Components of a time series with examples.
Measurement of trend- Graphical, Semi average, moving averages method (with period 3, 4 or 5 years) and method of least squares-related problems. Graphs of actual (Historigram) and trend values.
Fitting a linear trend, second degree (quadratic), exponential trend-obtaining trend values, estimating future values, drawing the actual and the trend values. Short term fluctuations.
Unit IV INTERPOLATION AND EXTRAPOLATION
Binomial expansion method Newton’s method of interpolation and extrapolation, conditions, formula and problems (with two missing values – one within and one outside the range).
Unit V THEORETICAL DISTRIBUTIONS
(a) Discrete probability distributions:
Bernoulli distribution – p.m.f., examples, mean and variance, features, problems.
Binomial Distribution, Poisson distribution – p.m.f., examples, mean and variance, features. For a given mean and variance, finding the parameters. Problems, Fitting, recurrence relation between successive probabilities and frequencies, obtaining expected frequencies.
Hyper-geometric distribution – p.m.f, features and problems.
(b) Continuous probability distributions:
Normal distribution – p.d.f., examples, properties, definition of SNV, standard normal distribution. Probabilities and expected numbers. Finding the probabilities within one, two and three s (sigma) limits.
Chi-square, Student’s t- distributions- p.d.f., features and their applications.
Unit VI STATISTICAL INFERENCE
1. Part: Population, sample, parameter, statistic, sample space, parameter space, sampling distribution. Definition of standard error, standard errors for mean, difference of mean, proportion and difference, uses.
Theory of Estimation: meaning of point estimation and interval estimation, confidence interval, confidence limits and confidence coefficient.
Testing of Hypothesis: Hypothesis: statistical hypothesis, null and alternative hypotheses, null distribution and test statistic.
Type I and II errors, size of a test, level of significance and power of a test.
Critical region and critical value, one and two-tailed tests with examples.
2. Part: Large sample tests: Testing for population mean and equality of two means, proportion and equality of two proportions with one and two tailed tests.
3. Part: Small sample tests:
(i) t- tests for population mean, equality of means and paired t – test.
(ii) Chi square test for testing of population variance, independence of attributes and goodness of fit.
Unit VII STATISTICAL QUALITY CONTROL
Meaning and its uses. Causes of variation – chance and assignable, explanation with examples, meaning of process control and product control with examples.
Control charts and control limits (with 3 s limits). Construction of and R-charts when sample means and ranges of 10 or less, samples of sizes 4 or 5 are given.
np or d-defectives chart and C-charts-defects and conclusions.
Meaning of acceptance sampling and uses. Description of single and double sampling plans, with relative merits and demerits.
Unit VIII OPERATIONS RESEARCH Meaning of O.R. and its Scope.
(a) Linear Programming Problem: Definition of LPP, Statement of its general form, Formulation of LPP with two variables and graphical solution-Feasible, Optimal, Multiple, Unbounded solutions.
(b) Transportation Problem- Statement of T. P., Feasible, basic feasible solution, degenerate solution, non-degenerate solution and optimal solution. Balanced and unbalanced T.P. Finding initial basic feasible solution by North-West Corner Rule and Method of matrix minima (low-est cost entry method). Determine the initial total transportation cost.
(c) Game problems: Meaning, characteristics of game, 2-person Zero-sum game, Pure and Mixed strategies, methods of solving a rectangular game with saddle point-Maximin-Minimax principle and Dominance principle.
(d) Replacement problems: Need for replacement, replacement of items that deteriorate with time [discrete case only] without considering change in the money value.
(e) Inventory problems: Meaning of Inventory and its need, Inventory costs, Lead time, Stock replenishment, Time horizon, E.O.Q model with and without shortages [without derivations], case of deterministic uniform demand, instantaneous production and no lead time.
Practicals: Each practical is of two hours duration.
We wish the data shed above will benefit you at the time of your preparation & gain good scores. So, download Karnataka State Board 2nd PUC Statistics Question Bank with Answers from here and become a topper in the final examinations. Moreover, keep in touch with our site & get all updated chapter wise KSEEB State Board Solutions for all subjects.